Exploring correlation hypotheses for causal reasoning is very popular, but often does not meet expectations.
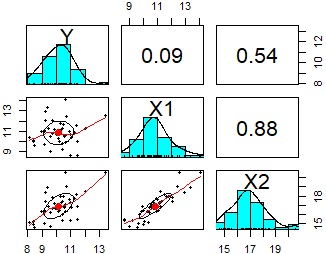
For example, as shown in the figure below, when you look at two variables, X1 and X2, that are highly correlated with the Y variable, Y may not be correlated with either.
Searching for hidden variables can be useful in these situations.
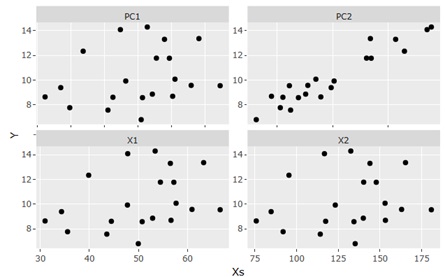
If there is a hidden variable, in the case of the above example, it will be as shown in the figure below. In this graph, the horizontal axis is the variable that is considered to be the causative system, and the vertical axis is Y.
Looking at this figure, we can see that the variables Y and PC2 are highly correlated. PC2 is a hidden variable.
Hidden variables are found when the variables X1 and X2 are a composite of the two variables.
Hidden variables are not visible when looking at variables in X1 and X2, only one of the composited variables is visible. For example, if the number of X1 is "10" and the result of the calculation of 10 = 9 + 1 is
that this number is obtained, then the variable of "9" is more visible and of "1". You can't see the variable on the other side.
The hidden variables were hidden because they were synthesized so that they had little effect.
If a hidden variable is found, it will be "found!", But subsequent data analysis is quite difficult.
This is because, unlike Y, X1, and X2, hidden variables are not actually measured, but are computationally inferred to exist.
It is necessary to make full use of meta-knowledge , such as "What are the factors that are combined and included in X1 and X2?"
The above is when a hidden variable is found, but the above example uses principal component analysis to find the hidden variable.
The principal components of principal component analysis are synthetic variables. Therefore, it seems strange to think of X1 as a composite variable and calculate the principal component as its element, but I found it this way.
It can also be found in independent component analysis .
A concrete calculation example using R can be found on the page for analyzing hidden variables with R.
The story of hidden variables is similar to the improvement of discriminant ability by double measurement .
Hidden variables cannot be found if there is only one X1 or X2. You need at least two variables.
It feels useless to have multiple similar data for the same phenomenon, but hidden variables cannot be found without such data.
Multicollinearity is a property of data that is often disliked because in general data analysis, multiple regression analysis can be very tedious and the interpretation of the data can be confusing .
However, hidden variables come from multicollinear data.
Even if there are variables such as hidden variables, they cannot always be extracted.
First, if the proportion contained in X1 or X2 is too small, it will be too hidden to be seen.
Also, if the proportions contained in X1 and X2 are the same, it will be difficult to find.
In the analysis of hidden variables by R , the variables of Y are separated from the data, and then principal component analysis and independent component analysis are performed.
The easiest way to find it is to compare Y with the principal components that come out of the separated data. If you don't do this, the effect of hidden variables will only look like an error and will be easy to overlook.
NEXT  Structure of data that becomes a directed graph
