Differentiation Data and Integration Data suggests that difference of the data is useful. This page is more about this use.
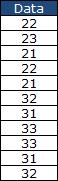
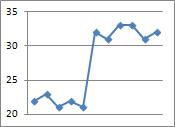
For example, there is a data and a graph below. The order of the data is time and the interval is equal.
The graph shows that there are low period and high period. And the change of the period is sudden.
In
Process Analysis for Abnormal Condition
, the information of timing of the change is often inportant.
Multi-Variable Analysis use the information of the data that "there are two class of numbers".
But the information of the data that "there is a sudden change" is not used.
If the information of "sudden change" is inportant for the analysis, Multi-Variable Analysis does not work well.
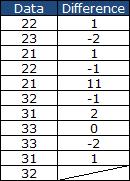
The table below is added the difference of the data. I call "difference data" in this page.
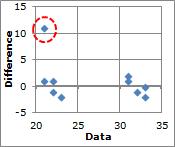
The dof plot is the relationship of original data and difference data.
The plot tells that there is a sudden change.
Difference covers the weak point of Multi-Variable Analysis. And Analysis of Type 1 becomes more powerful.
Not only difference from preivious data but difference from following data could be the difference data. The calculation of difference data is not one pattern.
In my experience, if the change is sudden, the selection of the calculation is important.

