Graphical Lasso is one of the Correlation Analysis for Multi-Variable using the idea of Sparce Modeling. It is also called "GGM (Graphical Gaussian Model".
If it seems be no relationship, this method thinks 0 for the index of the relationship. This process leads the simple thinking.
The isdea, "Use 0", is used in the old writings. And it is called "Graphical Modeling". In this method, 0 is used by hand not automatically.
And this method uses Partial Correlation. This process has the weakness that we cannot calculate the inverse-matrix.
Graphical Lasso realizes what old writings wanted.
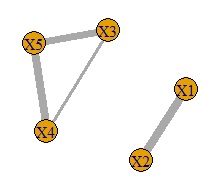
If we use the
sample data
and sample coad bellow, we can draw the ghraphs below.
library(glasso)
library(igraph)
setwd("C:/Rtest")
Data <- read.table("Data.csv", header=T, sep=",")
DataM <- as.matrix(Data)
COR <- cor(DataM)
RHO <- 0.2 # The number to change sparse condition
GM1 <- glasso(COR,RHO)$wi
GM1
write.csv(GM1, file = "GM.csv")
# To make data to draw the graph
diag(GM1) <- 0
GM2 <- abs(GM1)
GM2max <- max(GM2)
GM2max[GM2max==0] <- 1 # because this number is used as base
GM3 <- log10(GM2/GM2max*1000)*3 # To set the thickness of line.(Max becomes 9)
GM3[GM3==-Inf] <- 0
GM3[GM3<0] <- 0
rownames(GM3) <- rownames(COR)
colnames(GM3) <- colnames(COR)
GM4 <- graph.adjacency(GM3,weighted=T, mode = "undirected")
plot(GM4, edge.width=E(GM4)$weight)
NEXT  LiNGAM
