When you study mt method, you want to think that "it seems that you can express the state of abnormality by mathematical, so you can use it for cause analysis (causal reasoning)" of abnormality. (I myself did.) j
So, I proceed with the mt method procedure and calculate the distance of mahalanobis, but I get stuck, "How do I know the cause of the abnormality after this?". This page is about this situation.
I think that many problems in the world can be seen by one variable alone. For anomalies that can be seen with only one variable, you can use the methods of "outside the maximum and minimum values at normal time" and "3Å", so there is no need to use the MT method.
The MT method is valuable for two or more variables.
By the way, the calculation of the MT method can be performed even if there are about 100 variables, but in a real problem, it does not encounter an abnormal phenomenon in which 100 variables move complicatedly. At most it is decided by a few pieces. As for my experience, there are many other variables similar to those two or three.
The story is that this causes multiple colineability to worry about.
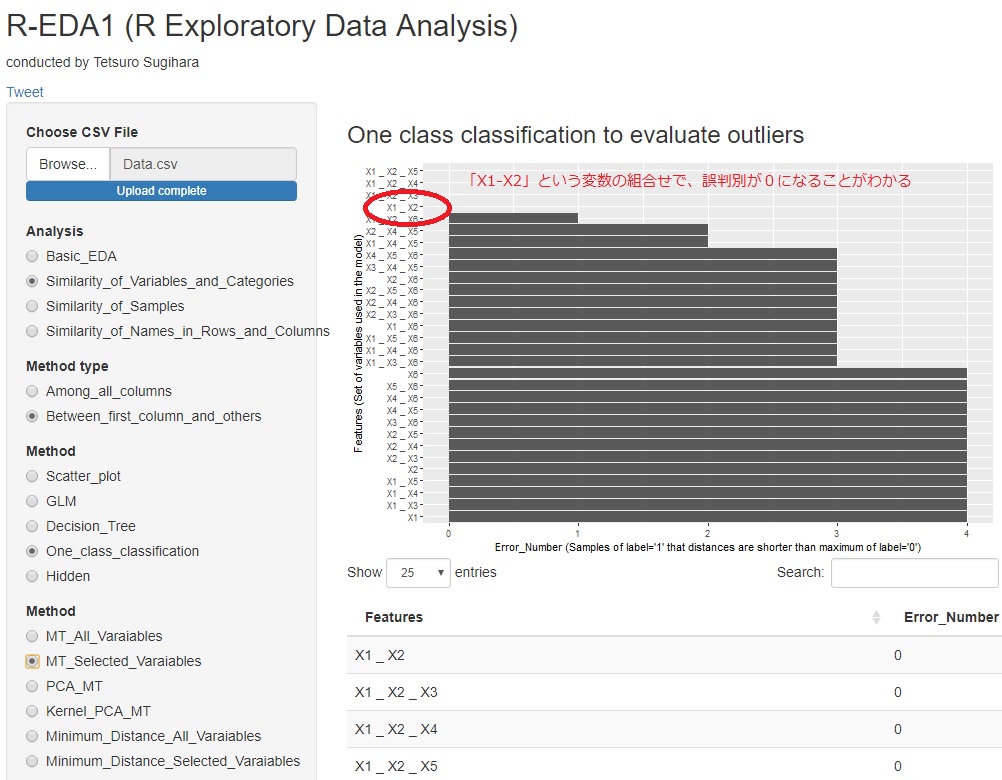
What you want to do with the MT method is to extract a few variable combinations.
R-EDA1 uses an algorithm that compares the Mahalanobis distance of a sample with the maximum Mahalanobis distance in unit space to the Mahalanobis distance of a sample in signal space for all combinations of one to three variables.
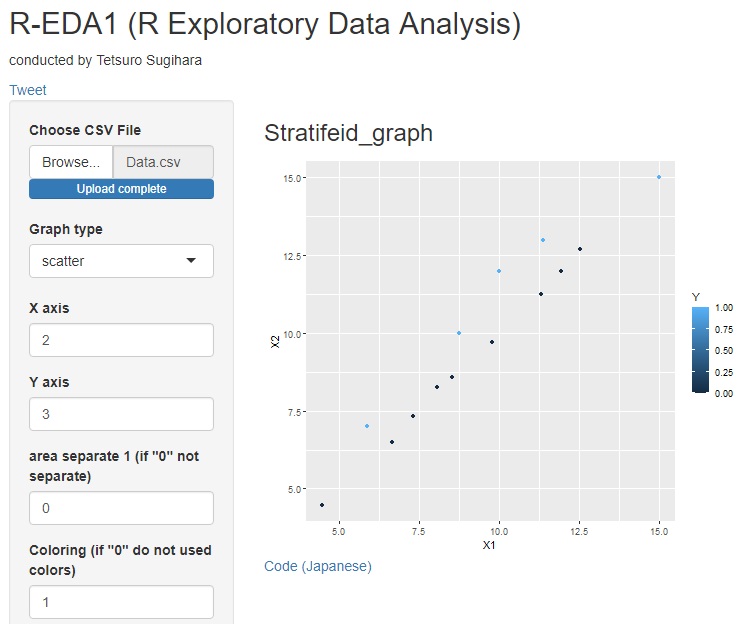
If you create scatter plots with variables X1 and X2, you can see that if the labels are 0 (black) and the labels are 1 (blue), the data are arranged differently. By the way, it is a feature of the MT method that such kind of abnormality can be analyzed.
In the explanation of mt method in the world, for all variables, there are two levels of "put in the model, do not put", and a method of examining the effect when the level is put using the experimental design method may be introduced.
NEXT  Difference of Good Distribution by Methods
