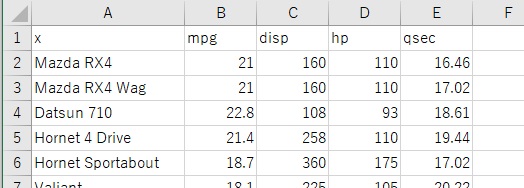
"mtcars" are data on the characteristics of automobiles. For each car, 11 types of evaluations are numerically expressed.
This page is an example of analysis with R-EDA1 from the perspectives of "what is this data?" And "what can be learned from this data?" .
Since R-EDA1 is not all-purpose, we plan to use EXCEL together.
The author obtains the data with the following code and makes it into a csv file. Save it in a folder called Rtest directly under the C drive.
write.csv(mtcars, row.names = FALSE, "C:/Rtest/mtcars.csv")
You can download the csv file saved in this site at the link of mtcars.csv . The saved file is "mtcars.csv", but it is downloaded as a file called "mtcars.xls", and there is a phenomenon that an error message meaning "extension is strange" appears. If you change the extension of the downloaded file from "xls" to "csv", you can use it without any problem.
From here on, I'm using a file called "mtcars.csv" in any location.
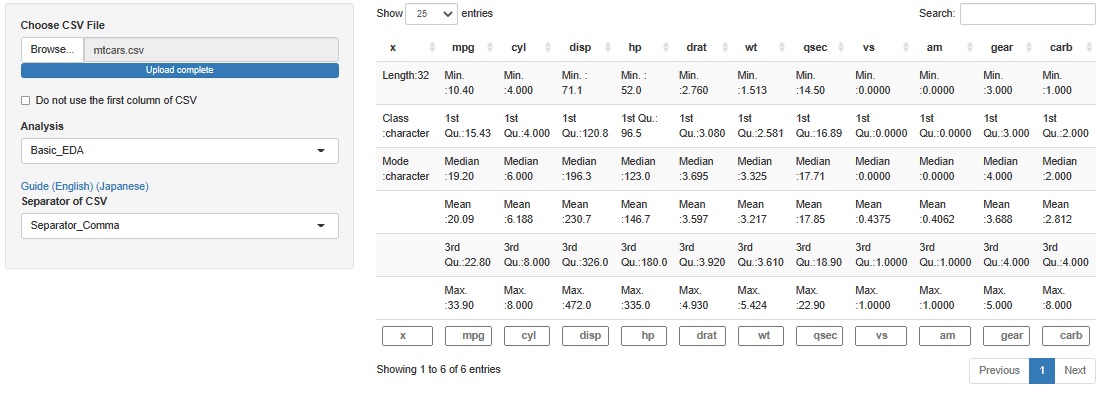
You can see that there are no missing values.
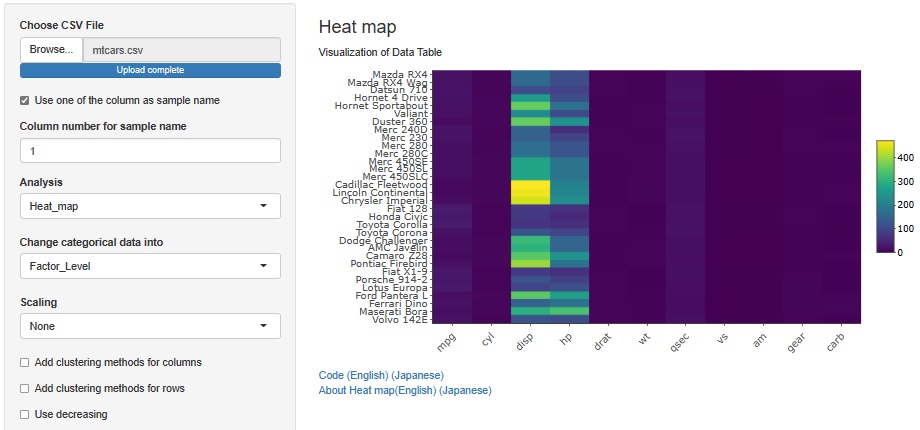
You can see that there are two types of variables with large values.
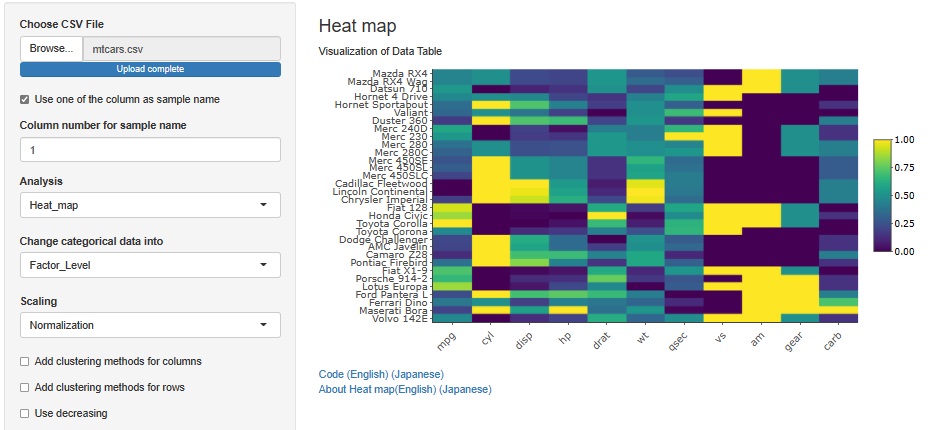
If you do Normalization, you can see that vs and am are two levels of data (binary data) because there are only two types of colors. vs means that the engine is V-shaped or straight, and V-shaped is 0. For am, Transmission is automatic or manual, and automatic is 0.
Also, since there are only 3 types of values for cyl and gear, you can see that they are 3 levels of data. cyl is the number of cylinders. gear is the number of gears.
From reference, https://stat.ethz.ch/R-manual/R-devel/library/datasets/html/mtcars.html.
mpg, disp, hp and qsec are data of performance.
cyl, drat, wt, vs, am, gear and carb are the causes of performance.
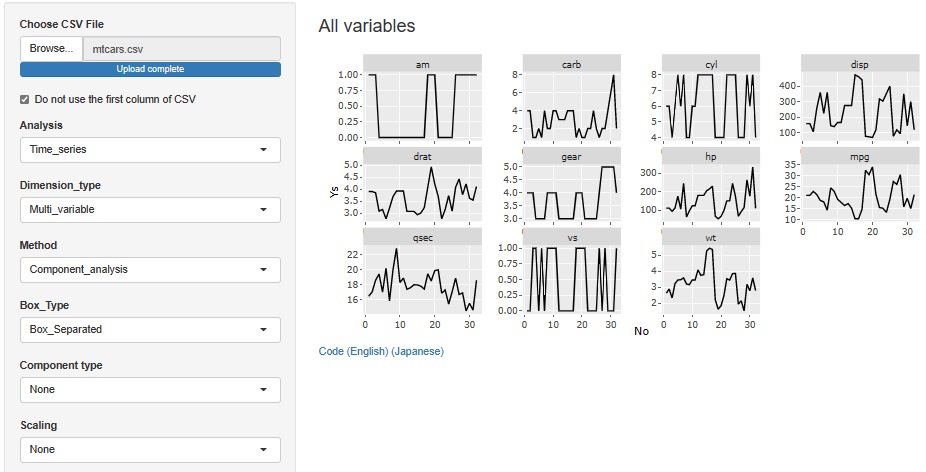
You can see that there are 3 types of even numbers of cyl, 4, 6 and 8 and they are at 3 levels. You can see that there are three types: gear, 3, 4, and 5.
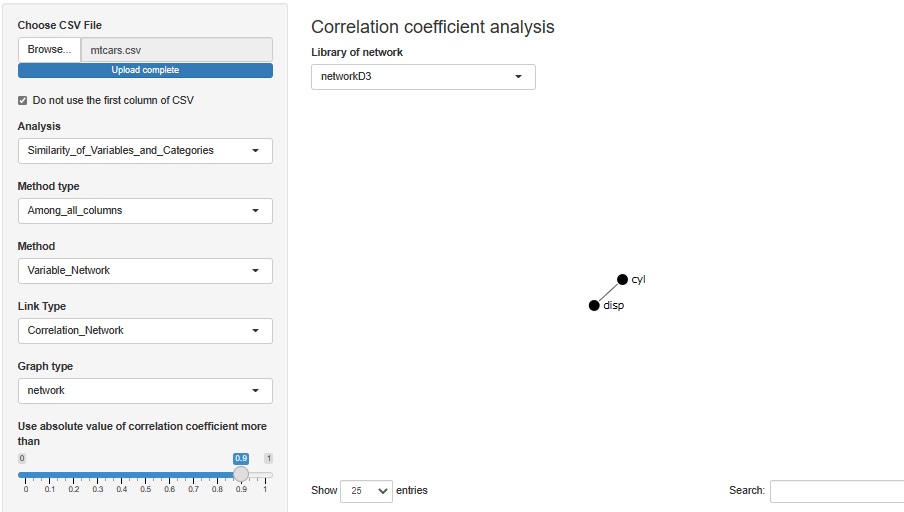
With a correlation coefficient of 0.9, cylinder (number of cylinders) and disp (displacement) are connected. It means that the displacement is roughly determined by the number of cylinders, but I think that's right.
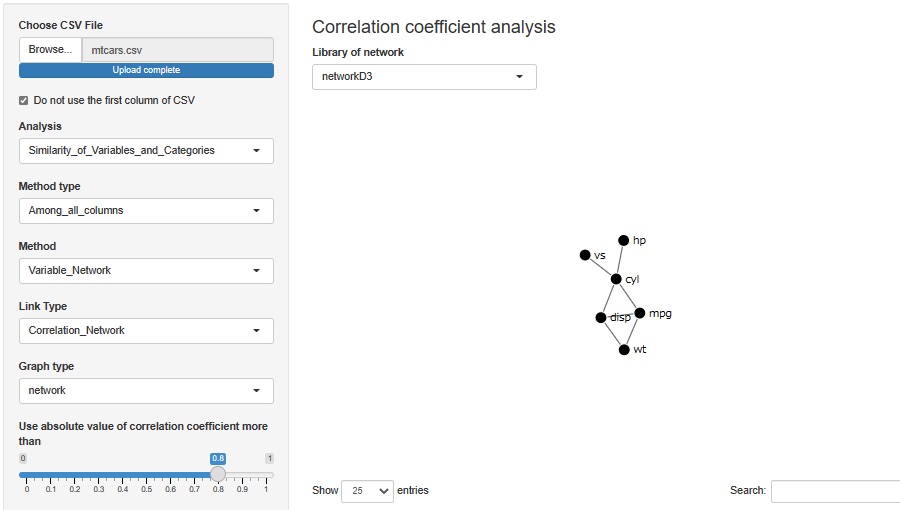
With a correlation coefficient of 0.8, hp (horsepower) and vs are connected to cyl, respectively. The horsepower changes depending on the number of cylinders, and the arrangement of cylinders changes depending on the number of cylinders. Also, I think that it is true that mpg (fuel efficiency) is related to cyl, disp, and wt (weight).
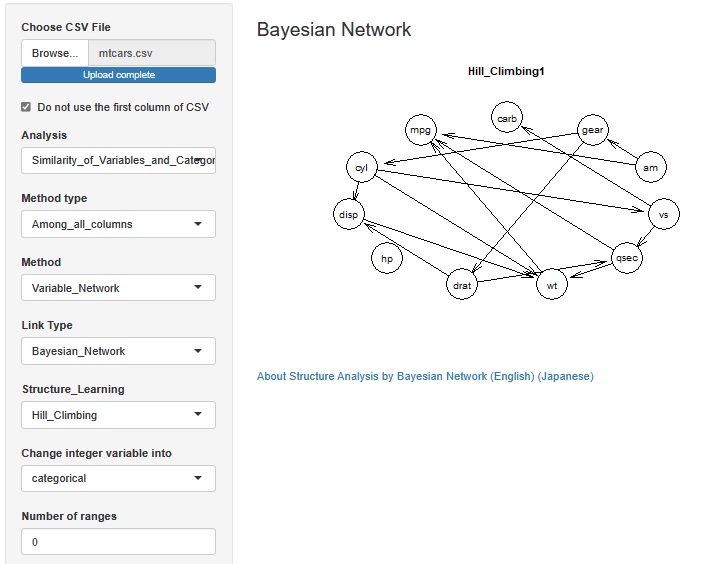
It is a kind of correlation analysis , but let 'sStructure Analysis by Bayesian Network .
When variables with integer values ??such as cyl and am are set to be treated as qualitative variables, arrows are drawn between qualitative variables and quantitative variables, and qualitative variables and quantitative variables are qualitative variables. An arrow was drawn from to the quantitative variable. It seems that the arrow is roughly in line with the causal relationship you are imagining.
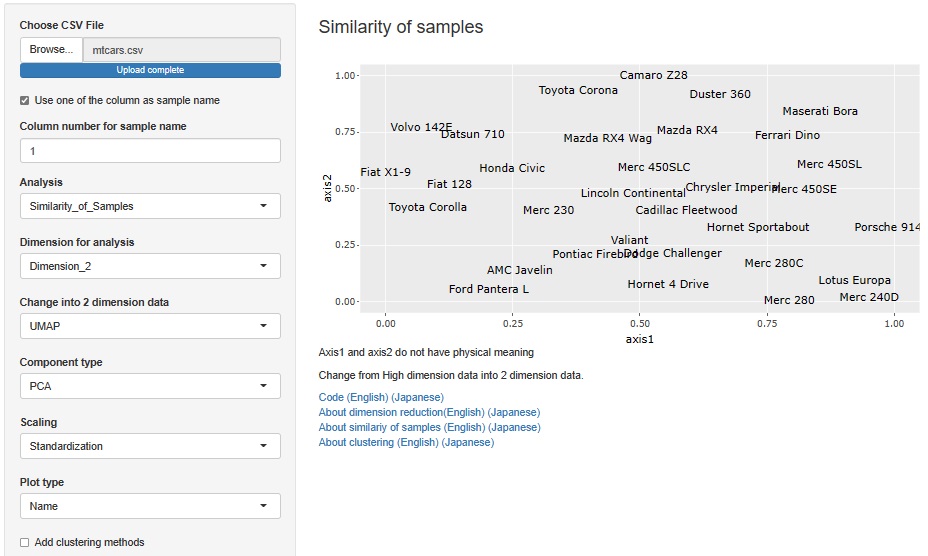
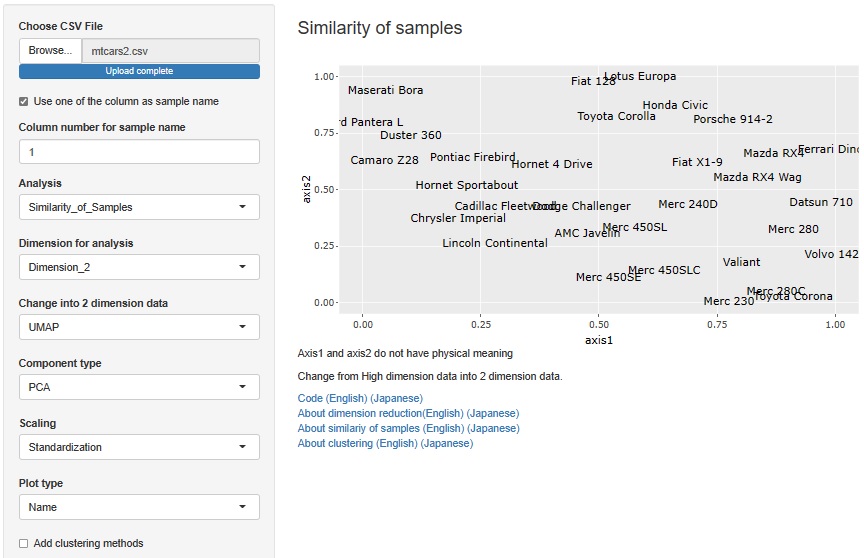
This is an analysis that examines things that are close to each other when viewed comprehensively.
If you do nothing preprocessing, it will be strongly affected by disp and hp, which have a wide range of values, but I do not expect it, so I will apply PCA. Furthermore, since we want to evaluate the influence of each main component equally, we will also apply Standardization.
It seems that the arrangement looks good because the ones with similar names are close to each other.
It is an analysis that examines close objects with only mpg, disp, hp, and qsec, which represent performance.
In the analysis below from here, variables other than mpg, disp, hp, and qsec are deleted, and a file called "mtcars2.csv" is created before analysis.
If you do nothing preprocessing, it will be strongly affected by disp and hp, which have a wide range of values, but I do not expect it, so I will apply PCA. Furthermore, since we want to evaluate the influence of each main component equally, we will also apply Standardization.
It seems that the arrangement looks good because the ones with similar names are close to each other.
mpg (fuel efficiency) is an important index in terms of dealing with environmental problems. Let's see how trying to improve mpg affects other indicators.
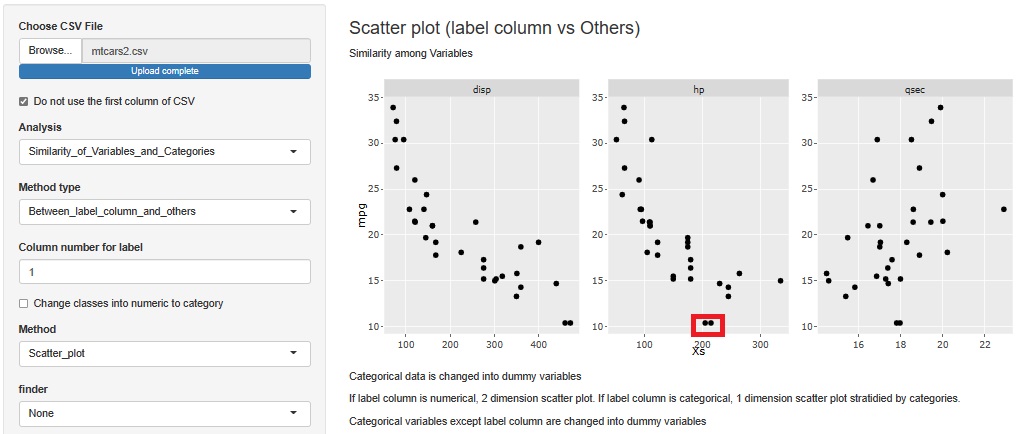
mpg is on the vertical axis and other variables are on the horizontal axis.
First, we can see that mpg and disp (displacement) have an inverse proportional relationship. The fact that the displacement is reduced when the fuel efficiency is improved means that the two indicators are compatible in terms of reducing the environmental load.
It can be seen that mpg and hp (horsepower) also have an inverse proportional relationship. If you try to get horsepower, you will have poor fuel economy. However, if you look only at the sample with hp of about 100, mpg has a range of about 18 to 30. Also, if you look only at the sample with mpg of about 15, hp ranges from 150 to 320. Analyzing the reason why this width is possible, it may be possible to achieve both the goodness of mpg and hp.
It seems that mpg and qsec have nothing to do with each other. In other words, you can see that you can make a car with high qsec and good fuel economy.
Let's consider the design conditions to make mpg and hp compatible. Therefore, create a variable called "mpg * hp" by multiplying mpg and hp, and delete mpg, hp, disp, and qsec from the data.
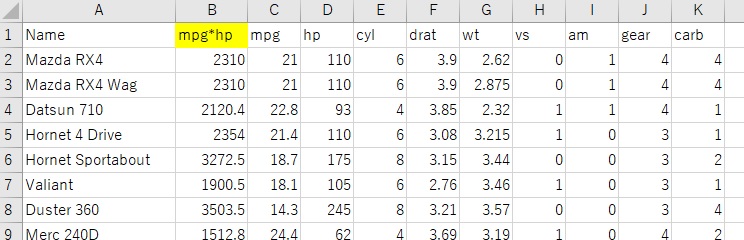
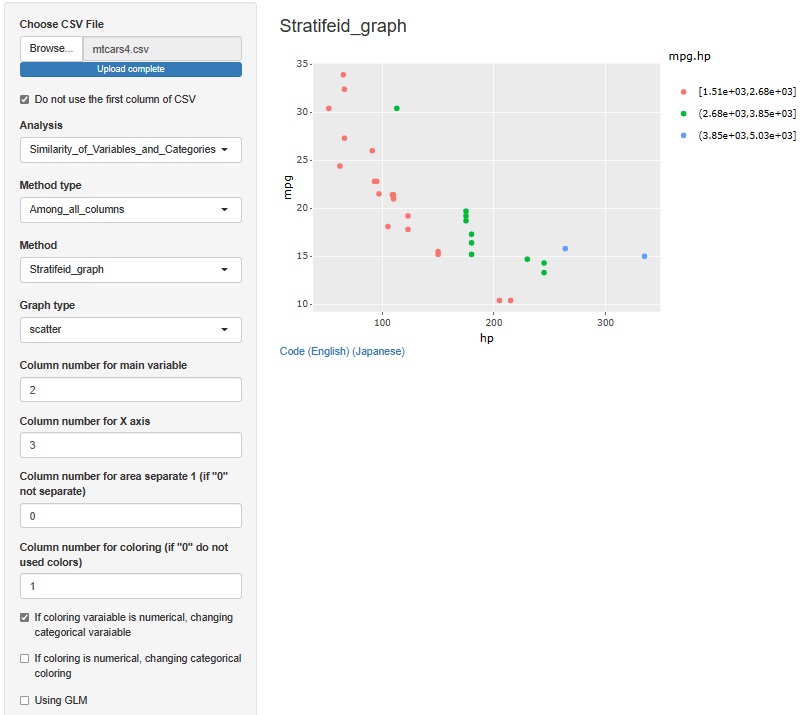
If horizontal axis to hp and the vertical axis to mpg and color-code by the value of mpg * hp, you can see that the sample with high mpg * hp is on the upper right side of the inverse proportional curve. If anything, samples with higher hp and lower mpg tend to have higher mpg * hp, and only one sample with lower hp and higher mpg has higher mpg * hp, so mpg is higher. It is an index that emphasizes higher hp than.
Therefore, we will normalize each of hp and mpg and then multiply them.
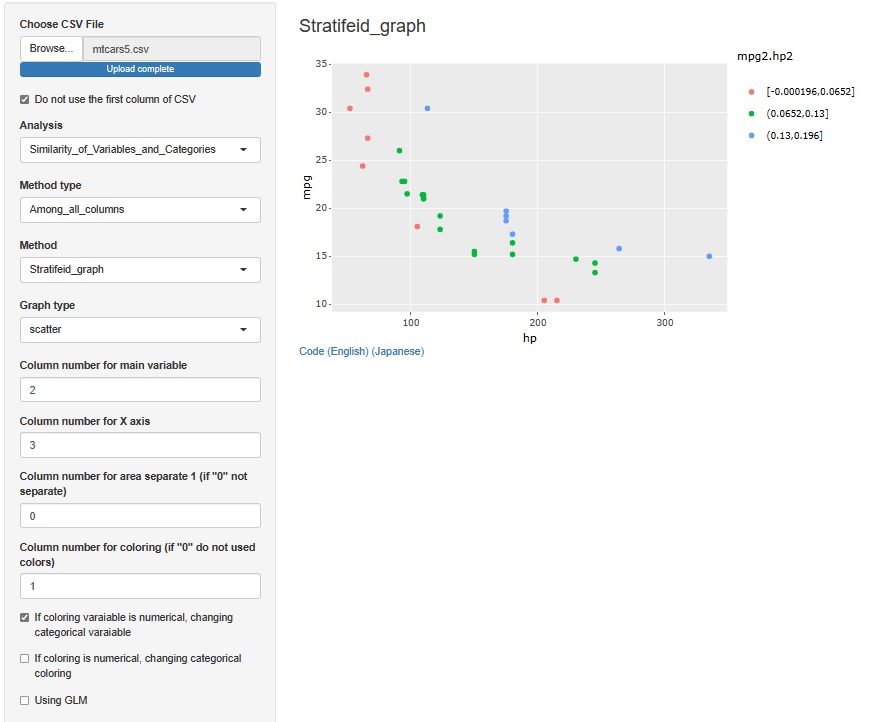
Then, the balance seems to be good this time, so I will use this index.
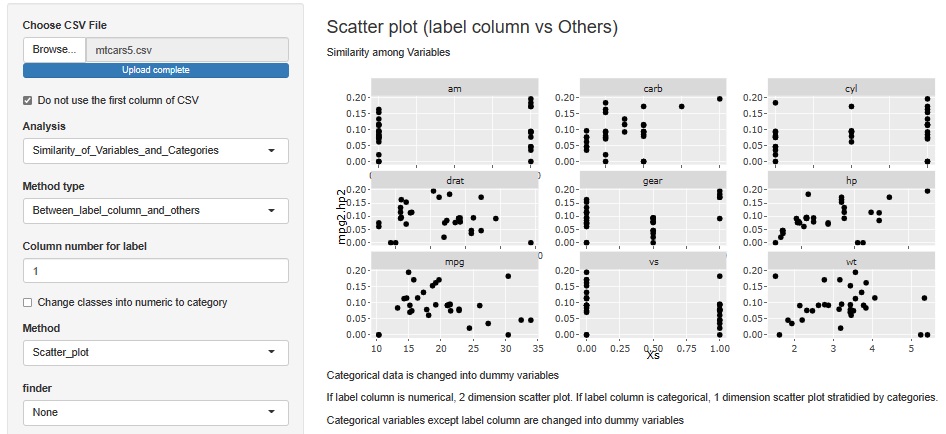
It is a scatter plot with mpg2 * hp2 on the vertical axis and other variables on the horizontal axis. It can be said that "vs is 0, that is, V type has higher mpg2 * hp2". This seems to be important for a design that balances mpg and hp.
é╗é╠æ╝é╠ĢŽÉöé╔é┬éóé─é═üAé▒éĻéŠé»é┼é═īŗś_éÅoéĄé╔éŁéóŖ┤éČé┼éĘüB gearé═üAÉ^é±Æåé╠4鬳Ļöįł½é╗éżé╔ī®é”éķé╠é═üAɽÄ┐éŲéĄé─é═¢╩öÆéóé┼éĘé¬üAé╚é║é╚é╠é┼éĄéÕéżüBüBüB
R Documentation
There is a detailed description of air mtcars data.
https://stat.ethz.ch/R-manual/R-devel/library/datasets/html/mtcars.html
