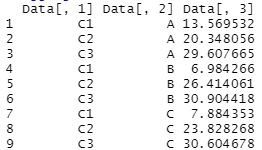
Data <- read.csv("Data.csv", header=T)
aggregate(Data[,3]~Data[,1]*Data[,2],data=Data,FUN=mean)
Crosstabs and contingency tables are not just a method of aggregation, but there are also methods of analyzing aggregated data, such as log-linear analysis .
This is an example when making a cross tabulation with R.
In this example, it is assumed that the folder "Rtest" on the C drive contains the following data with the name "Data.csv". In this example, the third column of the original data is processed as quantitative data, and the first and second columns are processed as qualitative data.
The average value is calculated for the number of combinations in the first and second columns. Set mean to sd to calculate the standard deviation.
setwd("C:/Rtest")
Data <- read.csv("Data.csv", header=T)
aggregate(Data[,3]~Data[,1]*Data[,2],data=Data,FUN=mean)
This is an example when creating a contingency table with R.
setwd("C:/Rtest")
Data <- read.csv("Data.csv", header=T)
table(Data[,1], Data[,2])

This is a method of aggregating qualitative variables without arranging them vertically and horizontally. When doing log-linear analysis , it is necessary to aggregate in this form.
Installation of dplyr is required in advance.
library(dplyr)
setwd("C:/Rtest")
Data <- read.csv("Data.csv", header=T)
count(group_by(Data,Data[,1:2],.drop=FALSE))
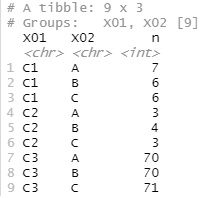
Without ".drop = FALSE", "0" will not be output when there is no match for the combination of conditions.
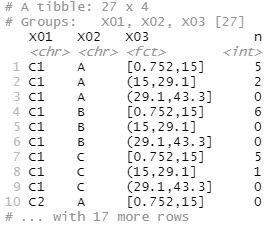
The following is a case where there is a technique to convert a quantitative variable into a qualitative variable (interval data) by one-dimensional clustering .
library(dplyr)
setwd("C:/Rtest")
Data <- read.csv("Data.csv", header=T)
for (i in 1:ncol(Data)) {
if (class(Data[,i]) == "numeric") {
Data[,i] <- droplevels(cut(Data[,i], breaks = 3,include.lowest = TRUE))# When dividing into three
}
}
count(group_by(Data,Data[,1:3],.drop=FALSE))