This is an example of LiNGAM by R.
How to find the coefficients of a model formula.
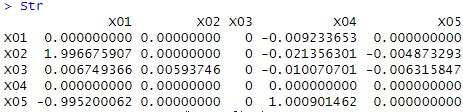
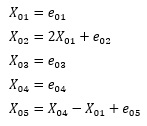
Here, the data created by the following formula is used. For e, we are using random numbers with a uniform distribution.
library(pcalg)
setwd("C:/Rtest")
Data <- read.csv("Data.csv", header=T)
Str <- lingam(Data)$Bpruned # LiNGAM
rownames(Str) <- colnames(Data)
colnames(Str) <- colnames(Data)
Str
The value that is almost the same as the coefficient when the data was created was obtained.
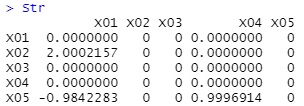
When you want to find out the magnitude of the influence of each variable in Multi-Regression Analysis , it is wrong to simply compare the coefficients of each variable in the regression equation, and compare the partial regression coefficients. The partial regression coefficient is the coefficient obtained by standardization then performing multiple regression analysis.
If you use LiNGAM for causality analysis, you will make the same mistake if you simply try to use the output of LiNGAM. Again, we'll standardize and then run LiNGAM.
Then, this coefficient is used as a numerical value indicating the magnitude of the influence for the thickness of the network structure.
library(pcalg)
library(igraph)
setwd("C:/Rtest")
Data <- read.csv("Data.csv", header=T)
for (i in 1:ncol(Data)) {
Data[,i] <- (Data[,i] - mean(Data[,i]))/sd(Data[,i])
}
Str <- lingam(Data)$Bpruned # LiNGAM
rownames(Str) <- colnames(Data)
colnames(Str) <- colnames(Data)
GM2 <- t(abs(Str))
GM3 <- GM2*5/max(GM2)
GM4 <- graph.adjacency(GM3,weighted=T, mode = "directed")
plot(GM4, edge.width=E(GM4)$weight)
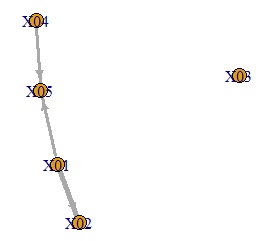
An error is added to the variable on the original side of the arrow to create a graph showing that it is the variable at the end of the arrow.
You need to have another library installed before you can use the library called pcalg. That seems to be the cause, and in some environments the above code will result in an error.
So here is the code to run LiNGAM without using pcalg: This is my own code. R-EDA1 also uses this code.
setwd("C:/Rtest")
Data <- read.csv("Data.csv", header=T)
independence_score <- function(x, r) {
abs(cor(tanh(x), r))
}
direct_lingam <- function(X) {
n <- nrow(X)
p <- ncol(X)
vars <- colnames(X)
causal_order <- c()
B <- matrix(0, p, p)
colnames(B) <- rownames(B) <- vars
X_work <- X
var_index <- 1:p
while (ncol(X_work) > 1) {
scores <- rep(0, ncol(X_work))
for (j in 1:ncol(X_work)) {
xj <- X_work[, j]
others <- X_work[, -j, drop = FALSE]
sc <- 0
for (k in 1:ncol(others)) {
fit <- lm(others[, k] ~ xj)
r <- resid(fit)
sc <- sc + independence_score(xj, r)
}
scores[j] <- sc
}
root <- which.min(scores)
root_name <- colnames(X_work)[root]
if (ncol(X_work) > 1) {
for (k in 1:ncol(X_work)) {
if (k != root) {
fit <- lm(X_work[, k] ~ X_work[, root])
B[var_index[k], var_index[root]] <- coef(fit)[2]
X_work[, k] <- resid(fit)
}
}
}
X_work <- X_work[, -root, drop = FALSE]
var_index <- var_index[-root]
}
list(
adjacency_matrix = B
)
}
Str <- direct_lingam(Data)$adjacency_matrix
Str