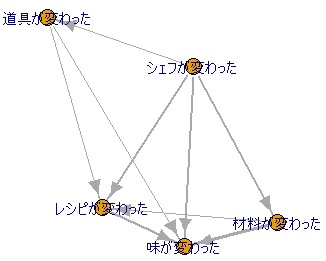
An association diagram is a diagram that uses arrows to represent causal relationships. It is also one of the new QC 7 tools .
When you create an association diagram, checking the correctness of the diagram is the same as Why-why Analysis . Regarding the direction of the arrow, check the "why" and "because" to see if the meaning is connected.
Diagrams similar to association diagrams also appear in Systems Thinking . Clarify the flow of things and information by putting them together in a diagram. By the way, System Dynamics is simulated by applying formulas to the individual relational parts in this diagram.
Network graph by R is the example to draw.

NEXT 

 Tree Diagram
