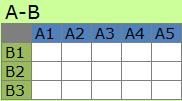
The AB type shows that there is a one-to-one relationship between the element of the viewpoint A and the element of the viewpoint B. In ABO analysis, we look at the one-to-one relationship between the elements and look at the relationship between A and B.

The AB type of many-to-many analysis may be this type at the beginning of data processing, or it may be made this type by some aggregation.
In the field of statistics, A of AB type is often used as a "variable" and B as a "sample". Most multivariate analysis and data mining techniques start with ABO data.
For this data, graphs such as line charts and heatmaps are useful ways to see the entire data . Histograms , box plots , and 2D scatter plots can be used to see the distribution of your data.
Mathematical perspectives include variable grouping analysis , sample grouping analysis , and individual category grouping analysis .
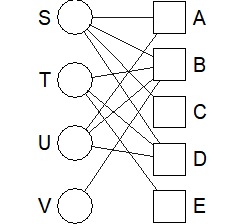
AB type is the data when making a bipartite graph in the field of networks . It represents the relationship between two different dimensions.
Cross tabulation is also AB type.
As a way to see the entire data, bar graph , but is common, heat maps and bipartite graph you may be better of.
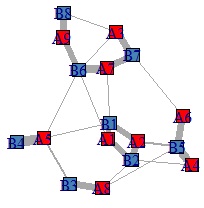
This site also introduces multidimensional simultaneous attachment diagrams and three-part graphs as AB type analysis methods .
It is an analysis method that combines an AB type mathematical analysis method and a graph, and allows deeper consideration than graphing the data as it is.
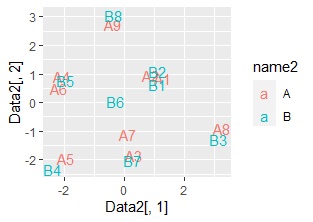
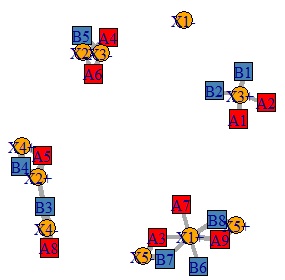
On the page for analyzing the similarity between items in row and column items by R , the AB type data may be qualitative data.
The AB-C type is a special type of the AB type. If you combine different datasets using the row items as keys, or if you create a contingency table with three columns, you will get this form (three-way contingency table).
Canonical correlation analysis is an AB-C type analysis method .
NEXT 

 Cross Tabulation
