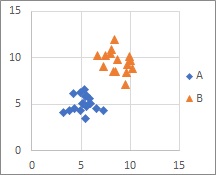
Discriminant Analysis , Logistic Regression Analysis , MT method , Decision Tree and Support Vector Machine use category data as Y.
They make similar output in some cases. But we may select bad method for the analysis.
Distributions with two or more chunks are good at any method.
Discriminant analysis by distance is suitable for distributions with two or more chunks. Other than that, I'm not good at it.
Discriminant analysis looks for a boundary line (more precisely, a boundary hyperplane?) To divide this mountain.
By the way, the decision tree also looks for boundaries, but it is not a boundary that can be expressed by a single formula. Logistic regression analysis and MT methods do not look for boundaries.

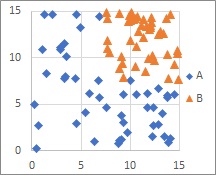
With either method, the distribution you can handle is when the samples are chunked by category. Support vector machines , logistic regression analysis , and decision trees can handle distributions that are solid, have samples scattered in space, and are unevenly scattered.
Support Vector Machine only look at samples around the border, so you don't have to have different categories of samples.
However, unlike logistic regression analysis, it is a method that tries to draw a boundary line, so it is not suitable when mixing in such a way that there is no such thing as a boundary line. Specifically, if there is no area where one of the data groups appears is 0.5 or more, an error will occur.
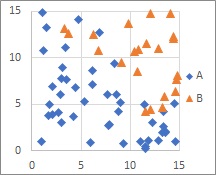
In Logistic Regression Analysis , samples in different categories are roughly separated, but not aggregated.
Logistic regression analysis can express " roughly " numerically using probabilities.
For example, if the occurrence rate of A is 0 in most areas and the maximum occurrence rate is 0.1 in some areas , the discrimination result will be all B in the label classification . Many techniques don't know much more, but logistic regression analysis can handle what happens with a low probability.
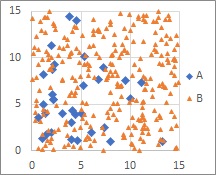
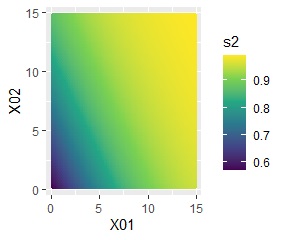
The Decision Tree a boundary line perpendicular to each axis, so if data is collected perpendicular to each axis, it will be divided accurately.
If a line that is not perpendicular to each axis is a border, the combination of vertical borders approximates it, complicating the model. Although it can be divided simply by changing the direction of the space, it may become a complicated division (model).
The MT method, the Mixture distribution MT , and the One-Class Minimum distance method can handle even if there is a lump in one category and there is a category that is not lump.
In the MT method, A is gathered. We assume a normal distribution. In the MT method, this group is called the unit space .
B has no aggregates or assumptions of a normal distribution. B is called the signal space.
In the MT method, the number of B samples does not affect the accuracy of the model. You can make a model with just one.
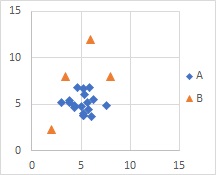
The Mixture distribution MT is suitable for distributions with multiple normal distributions.
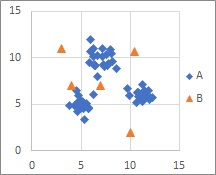
The One-Class Minimum distance method method is suitable when there is a collection of samples of A and B is separated. The shape of A can be anything.
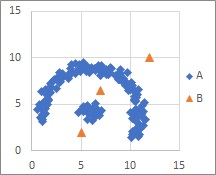
Examples of the distribusion in this page are simple.
For more complicated distributions, MT method are not suitable for the analysis. But Decision Tree is not so bad.
For Discriminant Analysis , Logistic Regression Analysis and Support Vector Machine , Kernel Method is the solution.
Neural Network and k-NN are strong for the complicated distribusions.
NEXT 

 Difference of Output by Methods
