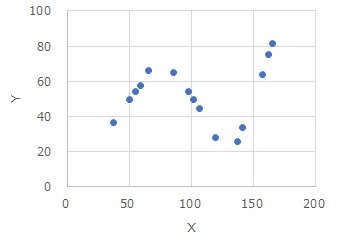
High-dimensional regression analysis is suitable for the above data. A simple regression analysis is clearly not suitable, but in the interval, a simple regression analysis seems to be fine.
The name "interval high-dimensional regression analysis" was coined by the author. If there is a similar method in the world, I will try to match it, but so far I have not been able to find such literature.

High-dimensional regression analysis is suitable for the above data. A simple regression analysis is clearly not suitable, but in the interval, a simple regression analysis seems to be fine.
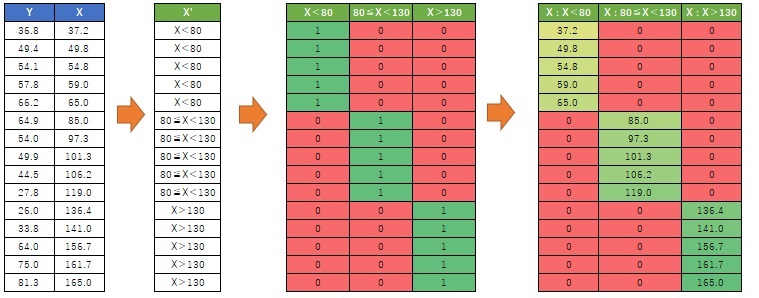
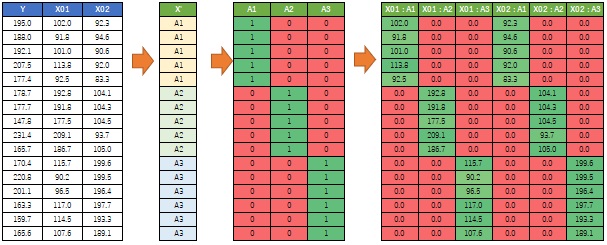
First, make the explanatory variables qualitative with One-dimensional clustering.
Next, do a dummy conversion.
Then make the product of the dummy transformed variable and the original X. Create a so-called interaction term.
The data set obtained by adding the newly created variable to the original Y becomes the data for interval high-dimensional regression analysis.
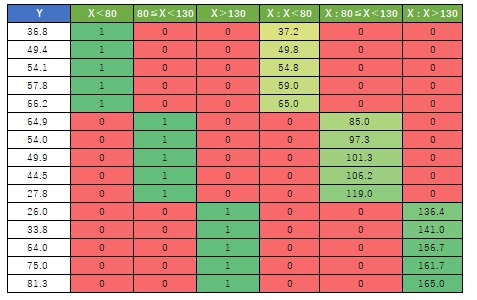
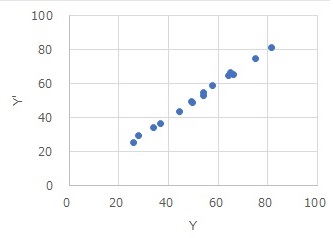
Once you have the data, the rest is a normal multiple regression analysis. If you make a scatter plot with the horizontal axis as the original Y and the vertical axis as the predicted value Y(Y'), you will see the figure below. Since it is almost straight, we can see that it is a model with very high accuracy. You can also see the slope of each interval from the analysis results.
In the example above, there is one explanatory variable, but the basic task is the same for multiple cases. We will convert the dimension of the interval one variable at a time.
If there is only one explanatory variable, it is not so troublesome to perform simple regression analysis individually by separating it with intervals. High-dimensionality regression is especially useful when you have multiple explanatory variables.
Interval high-dimensional regression analysis, Multivariate adaptive regression spline, Model tree, Support vector machine, Quantification I, Linear mixed model, 1D clustering We create a combination of the advantages of and the algorithms to realize those advantages. (This is how I came up with this technique.) If there is the same method in the world, it may be made with a different idea.
Interval high-dimensionalization regression is easier to understand when compared to these methods.
Similar approaches to regression analysis
Multivariate adaptive regression splines and model trees allow complex data to be supported by simple combinations of models by separating the space of explanatory variables and performing regression analysis for each interval.
This is the same for interval high-dimensional regression analysis. Each interval is identical in that it shows a simple regression model.
The kernel method of the support vector machine converts low-dimensional problems into high-dimensional problems, allowing complex data to be handled by simple models.
In addition, quantification class I and linear mixed models use dummy transformations of qualitative variables, which are higher-dimensional. By converting low-dimensional problems into high-dimensional problems, quantitative treatment is possible.
Interval high-dimensionalization regression analysis also deals with low-dimensional problems after converting them into high-dimensional problems. As with Quantification Class I and Linear Mixed Models, high-dimensionalization is performed by dummy transformation.
In a linear mixture model, you create a dummy transformation of a qualitative variable and an interaction term for other explanatory variables. Then, you can create a model with a different slope for each category of qualitative variables.
Interval high-dimensional regression analysis is the same in that qualitative variables are dummy-transformed to create interaction terms. It is also the same in that it creates a model with a different slope for each category of qualitative variables.
However, the qualitative variable is a qualitative variable by one-dimensional clustering of quantitative variables. We also create an interaction term between the dummy variable created from the qualitative variable and the original quantitative variable. These two points differ from the linear mixture model.
In the example above, the X interval is determined by looking at the graph of the original data. In the example of Interval High-dimensional regression analysis by R, I happened to divide the interval of the data into three and got a beautiful result, so I posted it.
In interval high-dimensional regression analysis, the one-dimensional clustering method can significantly change the results.
By the way, model trees have similar difficulties, so it is not a weakness of interval high-dimensional regression analysis alone.
If you try to apply interval high-dimensional regression analysis when there are multiple explanatory variables, the same process is applied to each explanatory variable as described above.
An alternative approach is to group samples into groups and create dummy variables for those groups. The grouping method in cluster analysis is called Vector quantization.
An image of the procedure looks like the one below.
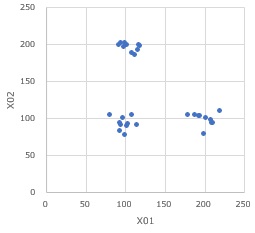
Cluster high-dimensional regression analysis can be used when there are samples in a multivariable space as shown in the figure below, and the model is different for each group.
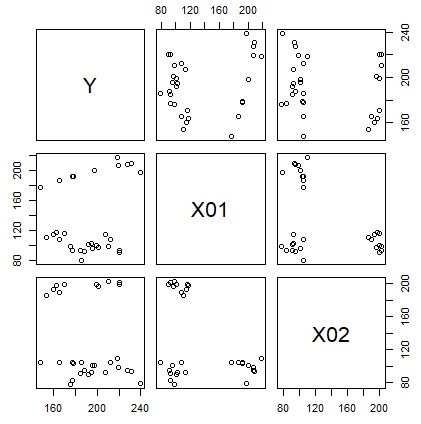
Cluster high-dimensional regression analysis is fairly close in approach to Model tree. If there is only one explanatory variable, interval high-dimensionalized regression analysis and cluster high-dimensional regression analysis are essentially the same.
All the examples of interval high-dimensionality regression analysis in this page are made in EXCEL.
1D clustering and dummy transformation are manual work, but if you want to do it, you can do it in EXCEL, which is the good thing about interval high-dimensional regression analysis.
An example of R can be found in Interval High-dimensional regression analysis by R. There is also an example of cluster high-dimensionalization regression.
NEXT 

 Linear mixed model of Proportional variance
