In Hypothesis Testing for Diffrence of Average , we use difference to compare 2 average. But we use ratio to compare 2 dispersion.
Standard deviation is popular as the index of dispersion. But we use variance to compare dispersion.
F-test is used to compare 2 variance.
setwd("C:/Rtest")
Data <- read.csv("Data.csv", header=T)
var.test(x=Data$X1,y=Data$X2)
Bartlett-test is used.
This method is used to check equality of variance before ANOVA .
Quality Engineering analyze the difference of dispersion. But it is not hypothesis testing.
setwd("C:/Rtest")
Data <- read.csv("Data.csv", header=T)
bartlett.test(formula=Data$Y~Data$X)
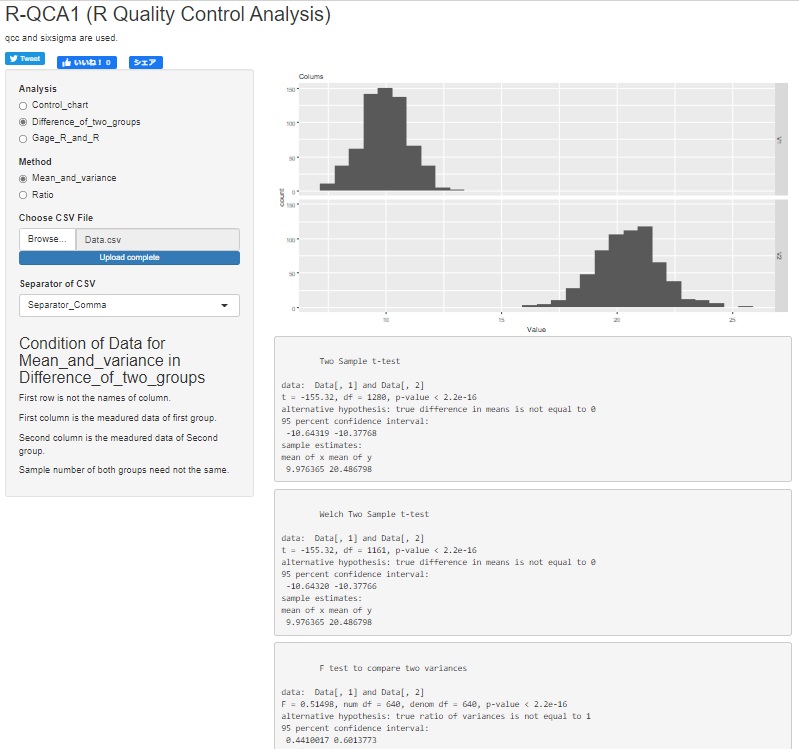
I think R-QCA1 is a good way to compare Before-After . You can prepare and read a csv file that contains the data of the group you want to compare in the first and second columns. Below the mean difference test, you will see the variance ratio test results.

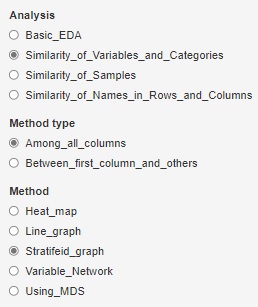
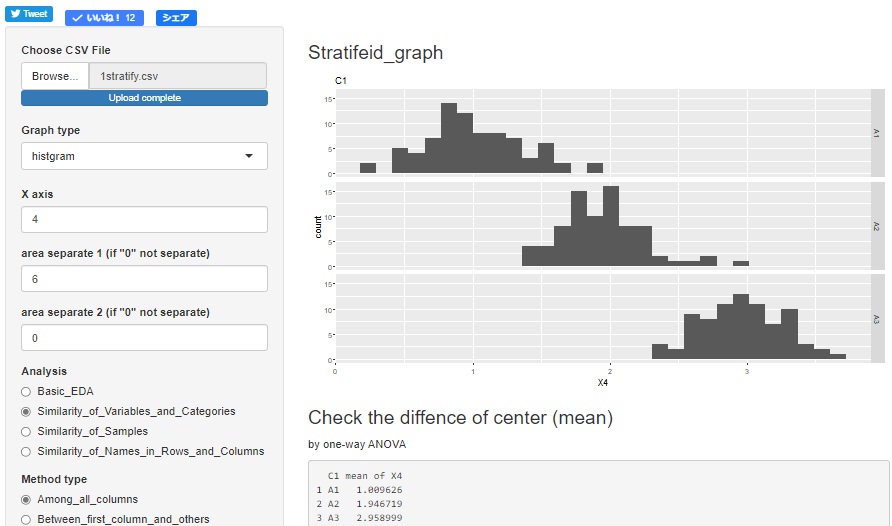
In R-EDA1 , select "Stratifeid_graph", select "histgram" or "box_plot", and when only one variable for stratification is selected, You can use the variables you choose to draw the graph for Bartlett's test. Below the graph are the results of the analysis of variance, and below that are the results of the Bartlett's test.


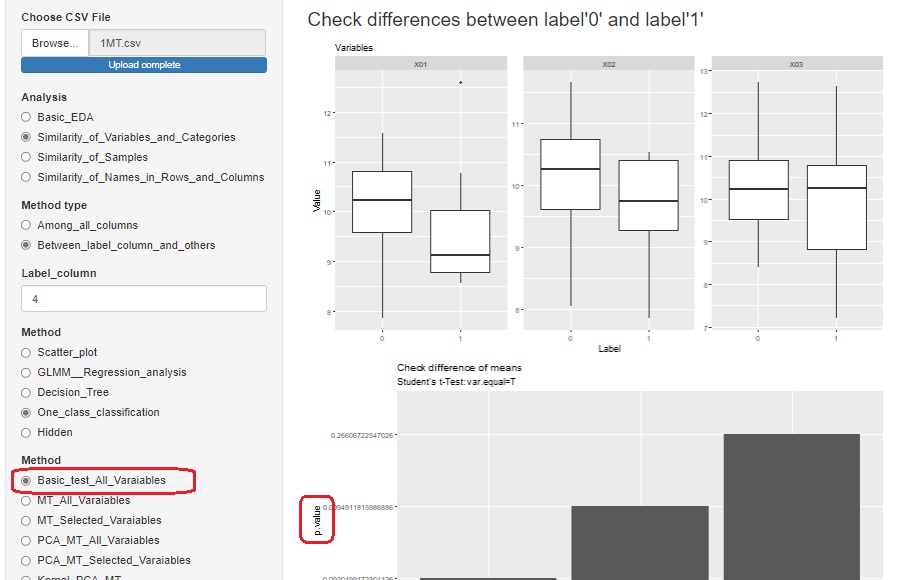
In R-EDA1 , if you select "Basic_test_All_Varaiables", each variable is stratified based on the variable of the label, and the ratio of the two population variances can be tested for all variables and the group with labels 0 and 1. It has become. Below the test for the difference in mean values ??is the test for the ratio of population variances. Only the p-value is output.

NEXT 

 Relationship between dispersion ratio, p-value, and number of samples
