 ANOVA stands for ANalysis Of VAriance.
 ANOVA stands for ANalysis Of VAriance.
ANOVA is a method to check the difference of average between more than two categories. "More than two" is a strong point of ANOVA.
The name ANOVA (analysis of variance) includes "variance" because it uses "variance" to compare "average". The target of ANOVA is average, not variance. This is the important point to understand ANOVA.
ANOVA is introduced in Design of Experiments as a method to analyze the result of experiments. But ANOVA is useful for other analysis when we want to compare average referring to unevenness.
Multiway ANOVA is introduced for the case that there are more than 2 factors in Design of Experiments .
For example, if there are 2 levels in both factor A and B, there are 4 ( = 2 * 2) groups. In this case we can do one-way ANOVA for 4 groups. But if we do two-way ANOVA, we can analyze each effect of factors.
ANOVA is calculated that variances of each group is equal.
We can use ANOVA if variances are not equal. But we need to take care of the output of the analysis.
Hypothesis testing for the difference of variansce is useful.
And
Graphical Statics
(
1-Dimension Scatter Plot
,
Box Plot
etc) are also useful.

We can also use Excel for one-way or two way ANOVA.
setwd("C:/Rtest") # Set the data file location
Data <- read.csv("Data.csv", header=T) # Read data
summary(aov(Y~X,data=Data)) # ANOVA
setwd("C:/Rtest")
Data <- read.csv("Data.csv", header=T)
summary(aov(Y~X1+X2,data=Data)) # Two-way ANOVA without Interaction
"+" is changed into "*".
If using interaction, repeated data is needed.
setwd("C:/Rtest")
Data <- read.csv("Data.csv", header=T)
summary(aov(Y~X1*X2,data=Data)) # Two-way ANOVA with Interaction
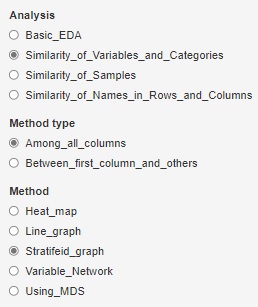
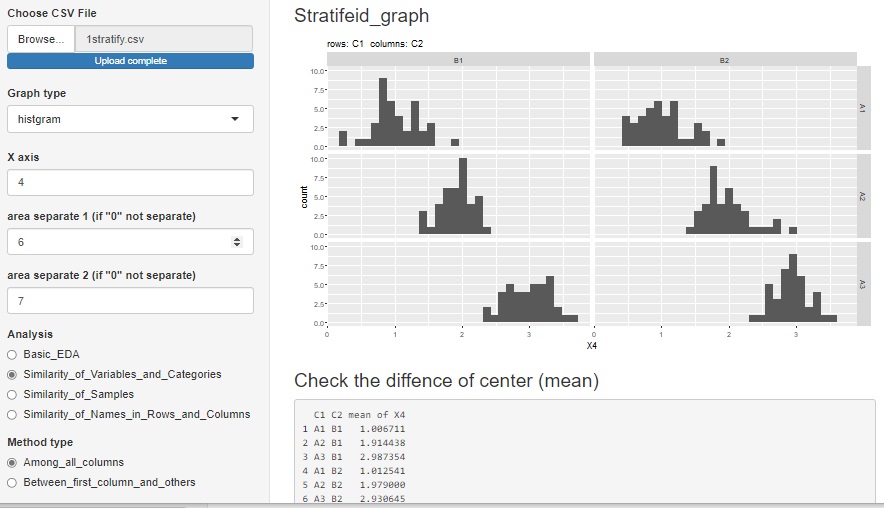
In R-EDA1 , select "Stratifeid_graph", select "histgram" or "box_plot", and use the variables selected to draw the graph for analysis of variance. I can. "Histgram" can be up to two elements, but "box_plot" can be three elements. Depending on the number of qualitative variables selected, one-way ANOVA to three-way ANOVA will be used automatically.


If you want to perform Multiway ANOVA with R-EDA1 for three or more elements , use the function of generalized linear mixed model .
If you run a generalized linear mixed model with data whose objective variable is a quantitative variable and whose explanatory variable is a qualitative variable , it will be the same as aMultiway ANOVA. R-EDA1 of generalized linear mixed model in, starting from the secondary of the full model (model there interaction), the term is not significant, the removed model will output.
Also, in ordinary ANOVA, a normal distribution is used as the distribution of errors, but another advantage of using a generalized linear mixed model is that you can use a non-normal distribution. This makes it possible to analyze using the Poisson distribution as the distribution of errors when the objective variable is not a metric value but a count value (counted data such as the number).
NEXT 

 ANOSS
ANOSS
