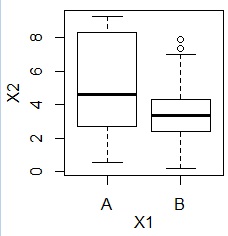
Box plot is one of the
Graphs of Disribution.
It use a box as the size of the data area.
It is useful to find the major area data because it is seen as a box.
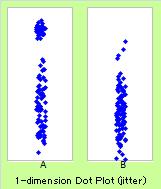
Box plot above and
Jitter scatter plot
below use same data.
It has a function to analyze outlier .
The size of the box does not depends on the numbers. So it is useful if we want to compare the distribution of different number.
Strongness could be the weakness. Tiny data group could be shown important group.
It can not use complicated distribution.
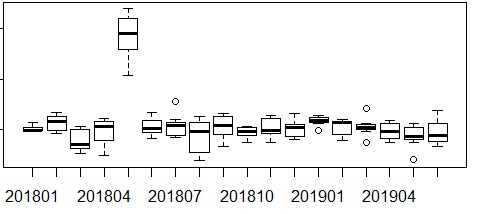
If groupes of the data is made by periods, the box plots could be the tools to analyze the change.
Line Graph
and
Histogram
is not used in this way.
Standard graph function of R , ggplot2 and Plotly
NEXT  Graphs for Change
