As you can see on the Strength and Weakness of Big Data page, when Hypothesis Testing against big data, the p-value is not useful at all as a criterion, and the effect size is useful.
The reason is that while the p-value is easily affected by n (data volume), there is no such thing as the effect size.
In addition, "big data" here is not a story of "million" or "billion". The problem of p-values for the test has become serious from about 100 or more.
In factories, tests such as preparing two groups of five (n = 5) are still common. In the case of factories, even preparing a single piece of data can be very time-consuming and expensive.
In that case, the old-fashioned method of "if the p-value is 0.05 or less, judge that there is a difference" is useful.
Then, the question arises, "What is the effect size when the factory judges that there is a difference?" So, I looked it up.
It's easy to do, albeit laborious. We created two sets of data for a group of n = 5 with random numbers, tested the difference in the mean values, and looked for cases where the p-value was between 0.049 and 0.050. In factories, one-tailed tests such as "Can we say that the average value has increased?" are often performed, so it is the p-value of the one-tailed test. In addition, in factories, there are many times when tests are performed without correspondence, so it is a test of the difference in average values without correspondence. When n = 5, the difference in variance cannot be discussed unless it is very good, so it is a test that assumes equal variance.
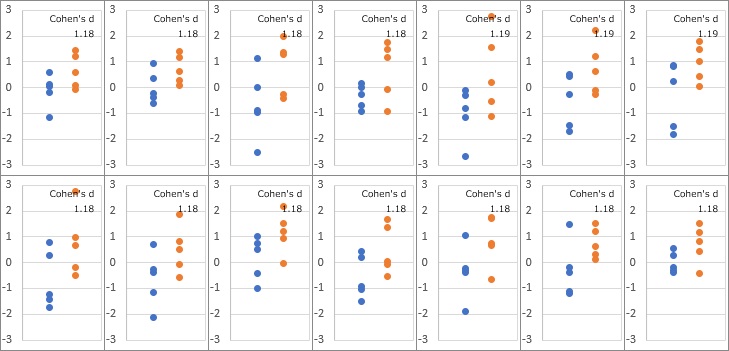
The figure below shows an example where the p-value is between 0.049 and 0.050. It is an image like "blue is before measures, orange is after measures". When factories get such data, it can be seen that they judge that "countermeasures are effective."

There are 14 ways, but the effect size (Cohen's D) was about 1.18.
As a guideline in the world, it is said to think that "0.8 is a big effect" and 0.2 is a small effect. If it is not about 1.18, it will not be judged as "difference". You are judging the effect much more carefully than that.
Using a p-value of 0.05 as a guide for small data is not a bad guide. Since there is little data, it is dangerous to make it sweeter (larger) than this. As a rule of thumb, thinking of the effect size as 0.8 means that the p-value is greater than 0.05.
Cohen's d is the difference in mean values divided by the standard deviation. It is easy to understand if you think of it in terms of the standard normal distribution, but the standard normal distribution has a mean value of 0 and a standard deviation of 1.
If we consider that the mean value deviates from the distribution where the standard deviation is 1, the denominator of Cohen's d is 1, so the magnitude of the difference in the mean value is Cohen's d as it is.
The standard normal distribution includes 70% of the samples between -1 and 1. Cohen's D of 1.18 is an area outside of 70% of the sample, so the average value is off quite clearly.
From the above, it can be seen that "if the p-value is roughly the same, the effect size will be roughly the same." If you make both of them into a scatter plot, it looks like the figure below.

NEXT 

 Hypothesis Testing for Diffrence of Dispersion
