 Rによるデータ分析 |
Pythonによる1対多のグラフ
 Rによるデータ分析 |
Pythonによる1対多のグラフ
1対多のグラフ です。
基本的に量的変数を扱う方法ですが、質的変数は ダミー変換 して質的・量的が混合していたり、質的変数だけでも使えるようにしてあります。
この方法の場合、質的変数同士の分析結果は、 Rによるカテゴリの類似度の分析 と似て来ます。
下記のコードでは、1つの変数というのは、「Y」という名前にしておく必要があります。 他の変数の名前は、特に指定はありません。
まずは、注目したい変数が量的変数の場合です。
library(fastDummies) # ライブラリを読み込み
library(ggplot2) # ライブラリを読み込み
library(tidyr) # ライブラリを読み込み
setwd("C:/Rtest") # 作業用ディレクトリを変更
Data <- read.csv("Data.csv", header=T) # データを読み込み
#Data2 <- dummy_cols(Data,remove_first_dummy = FALSE,remove_selected_columns = TRUE)
Data_long <- tidyr::gather(Data2, key="X", value = Xs, -Y) # 縦型に変換(Yの列以外を積み上げる)
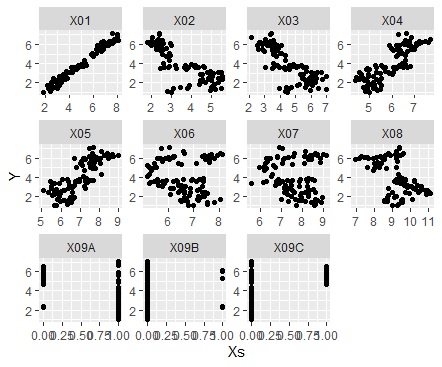
ggplot(Data_long, aes(x=Xs,y=Y)) + geom_point() + facet_wrap(~X,scales="free")# 散布図を大量に描く
注目したい変数が質的変数の場合です。
library(fastDummies) # ライブラリを読み込み
library(ggplot2) # ライブラリを読み込み
library(tidyr) # ライブラリを読み込み
setwd("C:/Rtest") # 作業用ディレクトリを変更
Data <- read.csv("Data.csv", header=T) # データを読み込み
Data1 <- Data # 加工用のデータを作る
Y <- Data1$Y # Yの列を別に作っておく
Data1$Y <- NULL # Yの列を消す
#Data2 <- dummy_cols(Data1,remove_first_dummy = FALSE,remove_selected_columns = TRUE)
Data3 <- cbind(Data2, Y)# 加工したデータとYの列を合わせる
Data_long <- tidyr::gather(Data3, key="X", value = Xs, -Y) # 縦型に変換(Yの列以外を積み上げる)
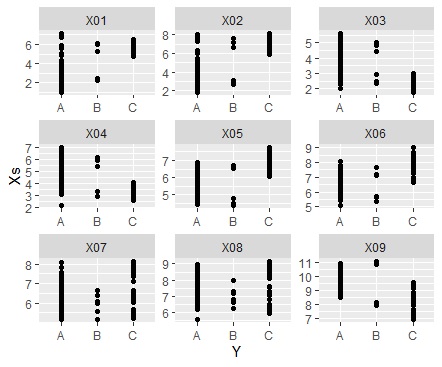
ggplot(Data_long, aes(x=Y,y=Xs)) + geom_point() + facet_wrap(~X,scales="free")# 1次元散布図
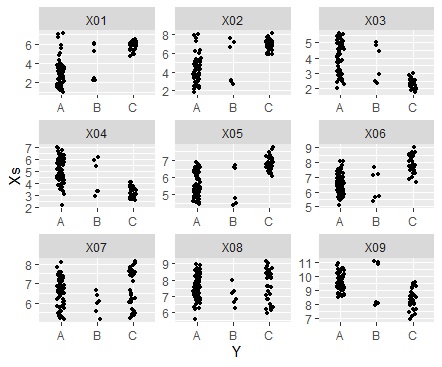
ggplot(Data_long, aes(x=Y,y=Xs)) + geom_jitter(size=1, position=position_jitter(0.1)) + facet_wrap(~X,scales="free")# ジター散布図
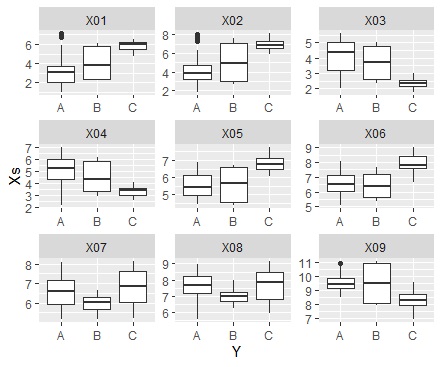
ggplot(Data_long, aes(x=Y,y=Xs)) + geom_boxplot() + facet_wrap(~X,scales="free")# 箱ひげ図
Rによる隠れ変数の分析 は、このページの方法の応用です。

