Histogram and heat map help the weakness of the scatter plot.
Histogram and heat map help the weakness of the scatter plot.
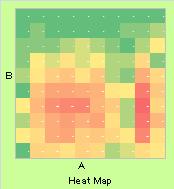
Heat map show the density of 2-dimension scatter plot by the colors.
The weak point is that the number of very low density area is difficult to study.
The strong point is that we can understand the density easily. If we want to find high density area, these graphs are useful.
NEXT  View of Network
 Tweet
Tweet