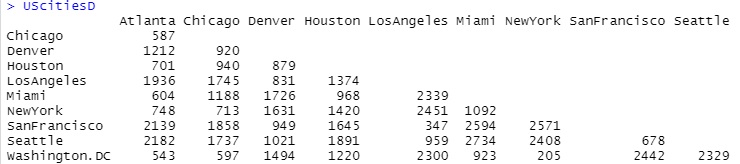
Both UScitiesD and eurodist are special matrices called distance matrices. UScitiesD is the distance data between US cities and eurodist is the distance data between European cities.
This page is an example of analysis with R-EDA1 R-EDA1 .
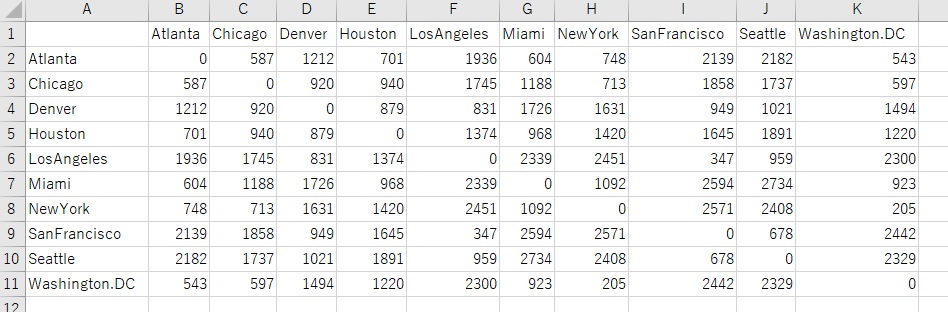
I obtains the data with the following code and makes it into a csv file. Save it in a folder called Rtest directly under the C drive.
write.csv(as.data.frame(as.matrix(UScitiesD)), row.names = TRUE, "C:/Rtest/UScitiesD.csv")
write.csv(as.data.frame(as.matrix(eurodist)), row.names = TRUE, "C:/Rtest/eurodist.csv")
You can download the csv files saved in this site at the links of UScitiesD.csv and eurodist.csv respectively. The saved file has the extension "csv", but it is downloaded as a file called "xls", and there is a phenomenon that an error message meaning "the extension is strange" appears. If you change the extension of the downloaded file from "xls" to "csv", you can use it without any problem.
The original data is the lower triangular matrix, but in the csv file, the numbers in the lower triangle are copied to the upper triangle.
From here, I'm using the files "UScitiesD.csv" and "eurodist.csv" in any location.
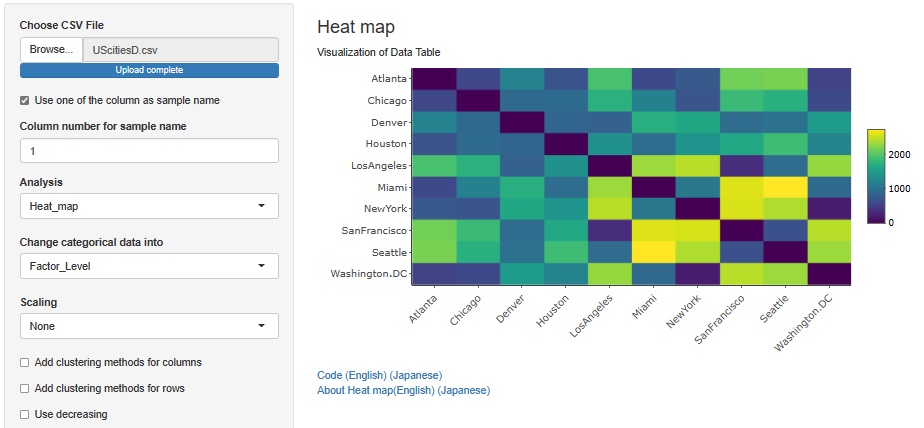
You can see the state of the distance matrix of UScitiesD by color.
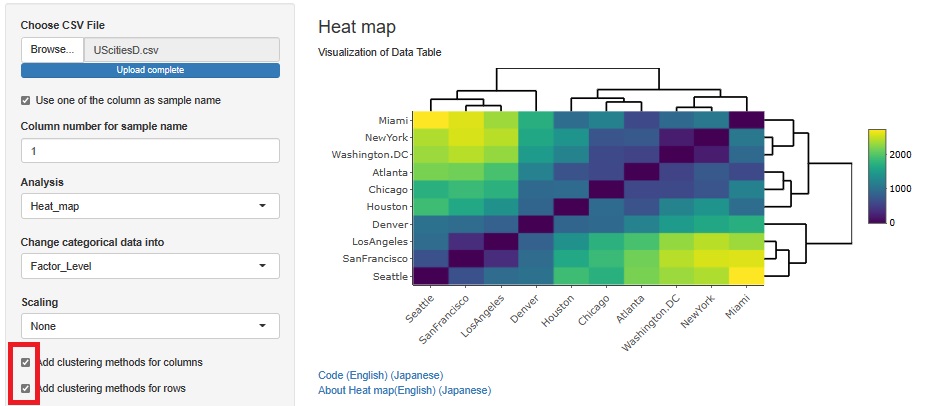
Clustering both the rows and columns made it easier to see what the numbers look like overall.
In UScitiesD, the cities on the west side are located on the left side (and the bottom side), the cities on the east side are located on the right side (and the top side), and the cities next to each other are particularly close.
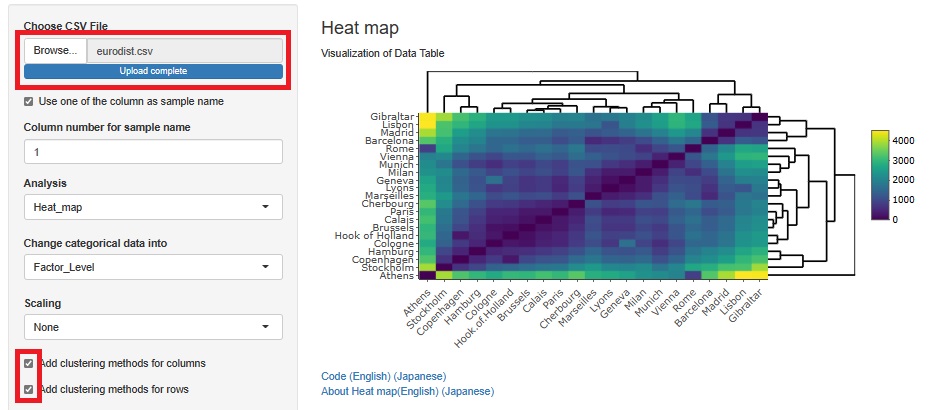
Using the same method for eurodist, Athene is treated exceptionally, with cities on the north side on the bottom (and left side) and cities on the south side on the top side (and right side). Athene is similar in shade to Rome, but with this clustering, Athene and Rome were not treated as close.
Let's calculate the coordinate data from the distance matrix using Multi Dimensional Scaling .
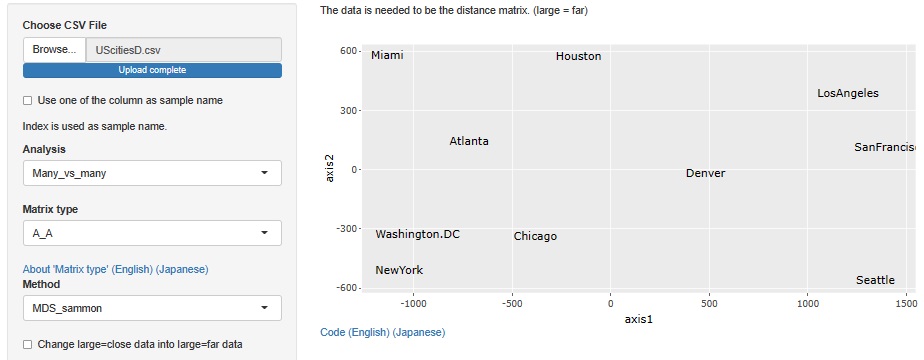
In UScitiesD, the east and west are reversed, and the layout is almost the same as the real map.
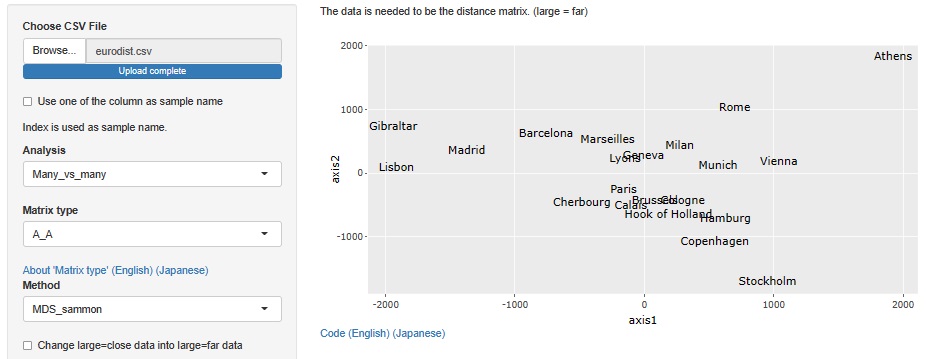
Using the same method for eurodist, the north-south arrangement was reversed.
