Knowing how to turn quantitative data into qualitative data and vice versa can increase the amount of data analysis you can do.
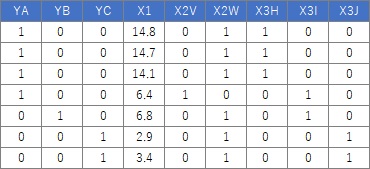
This is an example when executing Dummy Variable conversion in R.
Data Analysis by R often includes it as a standard pre-processing method for converting qualitative data into quantitative data .
In this example, it is assumed that the folder named "Rtest" on the C drive contains data with the name "Data.csv". Before this code, you need to install the library "dummies".
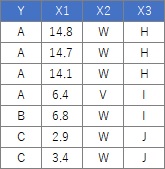
Data is a mixture of qualitative and quantitative data.
setwd("C:/Rtest")
library(dummies)
Data <- read.csv("Data.csv", header=T)
Data_dmy <- dummy.data.frame(Data)
write.csv(Data_dmy, file = "Output.csv")
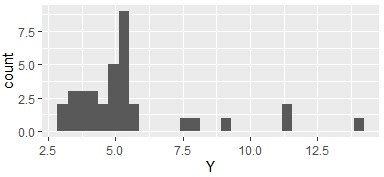
This is an example of executing One-dimensional clusteringin R.
Data Analysis by R often includes it as a standard pre-processing method for converting quantitative data into qualitative data .
Divide evenly between the maximum and minimum values ??of the data.
There are multiple methods below, but the input data is created in the same way, so they are summarized here.
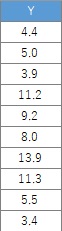
In this example, it is assumed that the folder named "Rtest" on the C drive contains data with the name "Data1.csv". There are 35 lines used here.
setwd("C:/Rtest")
Data1 <- read.csv("Data1.csv", header=T)
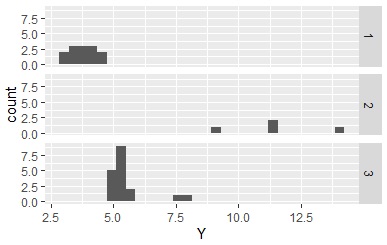
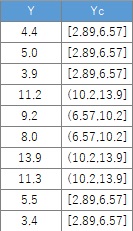
Data1$Yc <- droplevels(cut(Data1$Y, breaks = 3,include.lowest = TRUE))# When dividing into three. Add qualitative data to the original data.
Using the qualitative data obtained here, the histogram is divided as shown below.
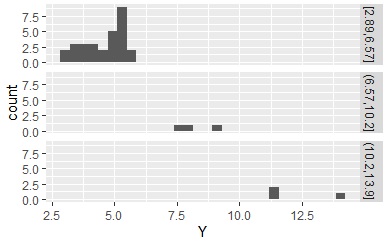
If you create a section and there is a section that does not have the corresponding data, there is no qualitative data, but the information that there is such a section remains. If this remains , this section will appear like a ghost when you make an N-try tree, which is a problem. If you enter " droplevels ", the information that there are sections will disappear for empty sections.
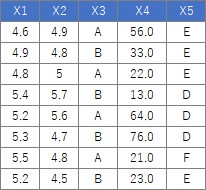
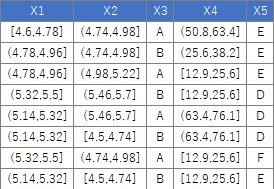
For the following data, the process of "converting the columns of quantitative data into qualitative data" can be performed as follows. Please note that the example data X4 has only 0 data after the decimal point, but the numbers after the decimal point are intentionally entered. Otherwise, the X4 column will be recognized as an "integer" instead of a "numeric", so this code will not split each interval. By the way, if you write so that "integer" is also divided, this process will be performed on columns with only "0 and 1" from the beginning, which is not good. You can write code to prevent these problems, but doing so complicates the code, so here we are trying to deal with it by paying attention to the input data.
setwd("C:/Rtest")
Data <- read.csv("Data.csv", header=T) <
for (i in 1:ncol(Data)) {
if (class(Data[,i]) == "numeric") {
Data[,i] <- droplevels(cut(Data[,i], breaks = 5,include.lowest = TRUE))# When dividing into 5 parts. Quantitative data is converted into qualitative data.
}
}
Specify the delimiter.
Data1$Yc <- droplevels(cut(Data1$Y, breaks = c(min(Data1$Y),5,7,max(Data1$Y)),include.lowest = TRUE))# 5 and 7 are separated do
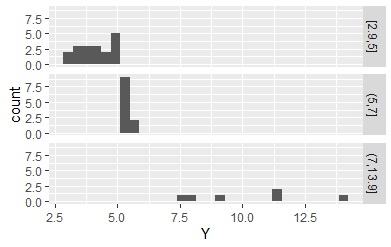
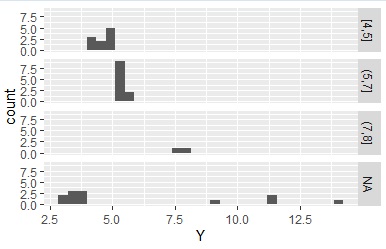
In the above example, all the data entered the specified interval because min and max are at the end of the delimiter, but if min and max are not used, the data that does not enter the interval will be classified as "NA".
Data1$Yc <- droplevels(cut(Data1$Y, breaks = c(4,5,7,8),include.lowest = TRUE))# 4, 5, 7, 8 are separated
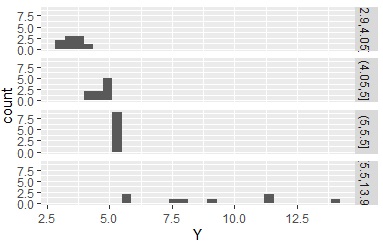
This is an application of the method of specifying the data interval delimiter. Using the maximum, minimum, median, and two quartiles, the number of data in each interval is approximately 25%.
Data1$Yc <- droplevels(cut(Data1$Y, breaks = c(min(Data1$Y),quantile(Data1$Y,0.25),median(Data1$Y),quantile(Data1$Y,0.75),max(Data1$Y)),include.lowest = TRUE))
The inconvenience of using cluster analysis is that the qualitative data does not represent intervals. Here, when using the k-means method.
Data1$Yc <- kmeans(Data1,3)$cluster # Classified by k-means method. This is for 3 groups