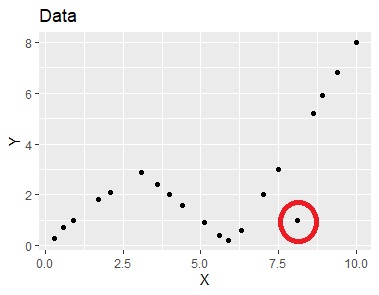
This is an example of Spline by R.
The example below uses the same data. Three straight lines are likely to apply, but the sample with a red circle is off that line.
setwd("C:/Rtest")
library(ggplot2)
Data <- read.csv("Data.csv", header=T)
x <- Data$X
y <- Data$Y
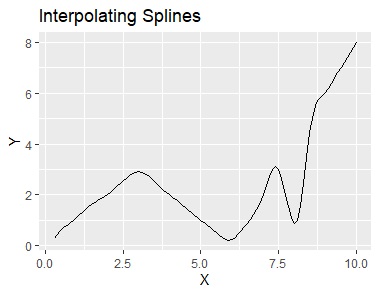
sp <- splinefun(x, y)
xpred <- seq(min(x), max(x), by = 0.1)
ypred <- sp(xpred)
Data2 <- as.data.frame(cbind(xpred, ypred))
ggplot(Data2, aes(x=xpred,y=ypred)) + geom_line()+ggtitle("Interpolating Splines")+xlab("X")+ylab("Y")
setwd("C:/Rtest")
library(mgcv)
library(ggplot2)
Data <- read.csv("Data.csv", header=T)
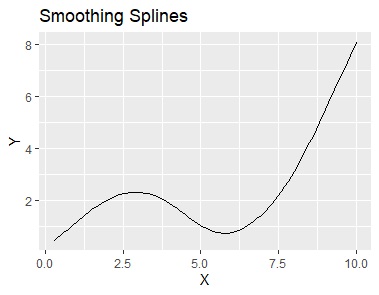
sp <- gam(Y~s(X), data=Data)
x <- Data$X
X <- seq(min(x), max(x), by = 0.1)
xpred<-as.data.frame(X)
ypred <- predict(sp,xpred)
Data2 <- as.data.frame(cbind(xpred, ypred))
ggplot(Data2, aes(x=X,y=ypred)) + geom_line()+ggtitle("Smoothing Splines")+xlab("X")+ylab("Y")
setwd("C:/Rtest")
library(earth)
library(ggplot2)
Data <- read.csv("Data.csv", header=T)
sp <- earth(Y~., data=Data)
x <- Data$X
X <- seq(min(x), max(x), by = 0.1)
xpred<-as.data.frame(X)
ypred <- predict(sp,xpred)
Data2 <- as.data.frame(cbind(xpred, ypred))
ggplot(Data2, aes(x=X,y=ypred)) + geom_line()+ggtitle("Multivariate Adaptive Regression Splines")+xlab("X")+ylab("Y")
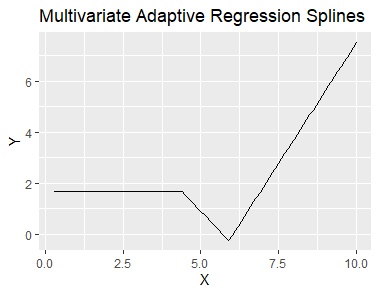
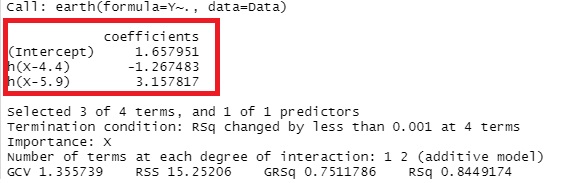
Multivariate adaptive regression splines allow you to generate mathematical formulas.
summary(sp)
"Multivariate adaptive regression spline"
4 packages of Multivariate adaptive regression spline for R are introduced.
"earth" is good for my use.
https://en.wikipedia.org/wiki/Multivariate_adaptive_regression_spline
"Package 'earth'"
Manual of earth package.
https://cran.r-project.org/web/packages/earth/earth.pdf
