This is an example of Logistic Regression Analysis by R.
Basic logistic regression analysis.
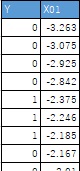
Here, the following data is used. It is assumed that the csv file of this data is in a folder called Rtest on the C drive.
setwd("C:/Rtest")
Data <- read.csv("Data.csv", header=T)
library(ggplot2)
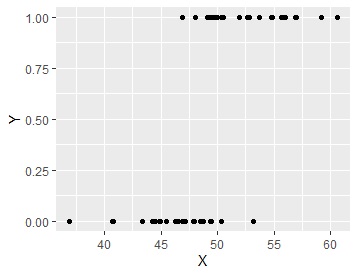
ggplot(Data, aes(x=X01, y=Y)) + geom_point()
library(nnet)
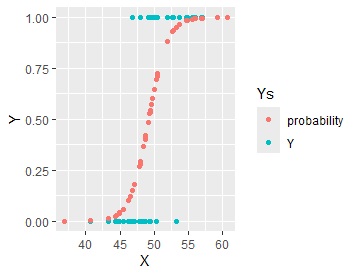
LR<-multinom(Y ~ X01, data=Data)
Data2 <- cbind(Data,LR$fitted.values)
ggplot(Data2, aes(x=X01,y=Data2[,3])) + geom_line() + geom_point()+ylab("probability")
When there are 3 or more categories.
Except for the part that creates the result graph, you can do it in the same procedure as for binary.
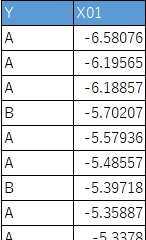
Here, the following data is used.
setwd("C:/Rtest")
Data <- read.csv("Data.csv", header=T)
library(ggplot2)
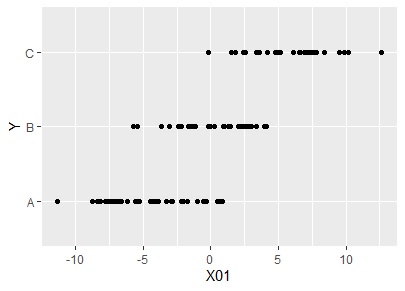
ggplot(Data, aes(x=X01, y=Y)) + geom_point()
library(nnet)
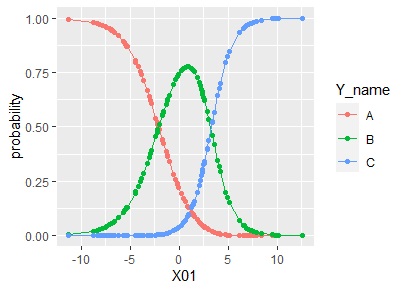
LR<-multinom(Y ~ X01, data=Data)
Data2 <- cbind(Data,LR$fitted.values)
Data2$Y <- NULL
library(tidyr)
Data_long <- tidyr::gather(Data2, key="Y_name", value = probability, -X01)
ggplot(Data_long, aes(x=X01,y=probability, colour=Y_name)) + geom_line() + geom_point()
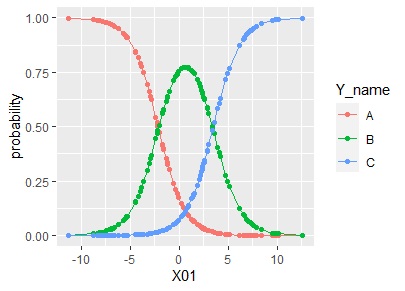
When there are 3 or more categories and the order of the categories is meaningful.
Here, the following data is used.
setwd("C:/Rtest")
Data <- read.csv("Data.csv", header=T)
library(ggplot2)
ggplot(Data, aes(x=X01, y=Y)) + geom_point()
library(MASS)
Data$Y <- as.factor(Data$Y)
LR<-polr(Y ~ X01, data=Data)
library(tidyr)
Data_long <- tidyr::gather(Data2, key="Y_name", value = probability, -X01)
ggplot(Data_long, aes(x=X01,y=probability, colour=Y_name)) + geom_line() + geom_point()
CRAN
https://cran.r-project.org/web/packages/MASS/MASS.pdf
MASS manual.
CRAN
https://cran.r-project.org/web/packages/nnet/nnet.pdf
nnet manual
