This is an example of when conducting Cause-Effect Analysis of Indivisual Samples in R.
Applications of causal inference between variables include analyzing the similarity of variables in R and investigating them in decision trees using R.
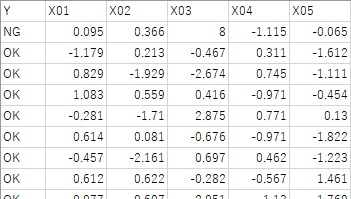
In the sample data used in the example below, there are X01 to X05. The first line is the sample for which you want to make causal inferences, and the Y value is "NG". X03 contains a relatively large value. Except for the first line, the Y value is "OK".
If you have multiple samples that you want to examine and you believe that they share common characteristics, For example, if you set Y as "NG" and "OK" for the other groups of abnormal samples, you can analyze multiple samples together.
The Decision tree by R page is used for general data analysis of decision trees. When used for causal inference of individual samples, it needs to be slightly arranged.
First of all, in the causal inference of individual samples, the samples you want to examine are often from one to several, so if the minimum number of samples contained in the leaves remains the default, I can't inspect the tree without branching. So, change the minimum number of samples. Also, in a random forest, you will grow a large number of trees, but the sample you want to examine may not be included in the trees, so the general random forest is not suitable. If you want to make it a random forest, it is better to use only random sampling of variables and not random sampling of samples.
The following is an example of rpart.
setwd("C:/Rtest")
library(partykit)
library(rpart)
Data <- read.csv("Data.csv", header=T)
treeModel <- rpart(Y ~ ., data = Data,control = rpart.control(minsplit = 1))
plot(as.party(treeModel))
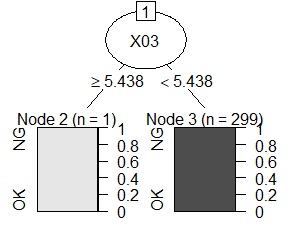
It was derived that X03 is a feature of this sample.
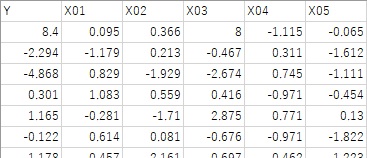
In the sample data used in the following example, it is from X01 to X05, where Y is the linear sum of X01, X02, and X03, and X04 and X05 are data that is independent of Y.
The first line is the sample for which you want to make a causal inference, and X03 contains a relatively large value.
 The method of calculating SHAP is to examine only one sample. If you want to examine more than one, you will have to repeat the same process and aggregate the results that come out.
library(iml)
setwd("C:/Rtest")
Data <- read.csv("Data.csv", header=T)
Data1 <- Data
Data1$Y <- NULL
library(randomForest)
DataModel = randomForest(Y ~ ., data = Data)
predictor = Predictor$new(DataModel, data = Data1, y = Data$Y)
shapley = Shapley$new(predictor, x.interest = Data1[1,])shap of line 1
shapley$plot()
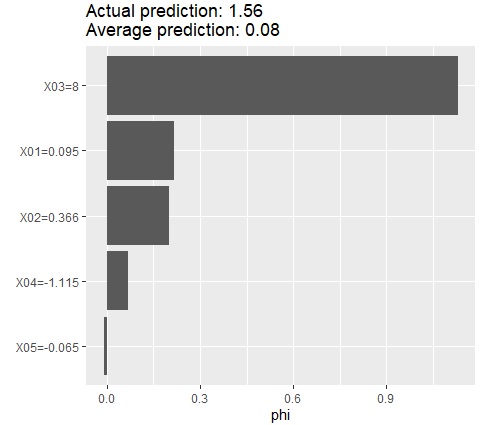
It was derived that X03 is a feature of this sample.
For the above method, if you want to change the model, rewrite the two lines around the middle. For example, for multiple regression analysis (generalized linear model), enter the following two lines.
library(MASS)
DataModel = glm(Y ~ ., data=Data, family= gaussian(link = "identity"))
