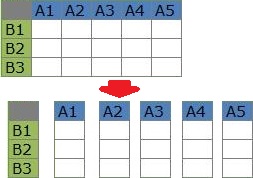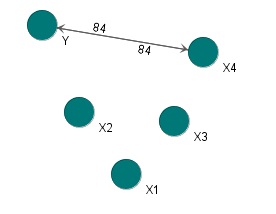
In the analysis of variable companions, the table of data is cut vertically into strips to see the closeness between strips.

Analyzing variable classification is the first step in data mining, as if you had a lot of variables, but couldn't you categorize them?
It is also used as an analysis for selecting variables in multi-variable analysis, considering multiple colineths.
For quantity variables, you can use multi-variable data correlation analysis, component analysis, matrix decomposition, and quasicorrelative analysis to analyze variable companioning.
For qualitative variables, the test for independence is a way to examine the closeness between two variables, so if you run this in a combination of all variables, you can use it as an analysis of variable companionry.
For three or more cases, there is a d'eline analysis.
Natto is a free software that allows you to analyze the correlation of qualitative variables. I don't know any software other than Natto that can "perform the independence test with a combination of all variables".
Natto can be analyzed by converting qualitative variables into qualitative variables when they are mixed.
By the way, Natto can also analyze the category of individual categories.

The correlation of the quantity variables shows the height of the correlation by whether the data is close to a single straight line when drawing a scatter plot with two variables. This results in a linear evaluation.
Considering this idea in terms of the correlation of qualitative variables, the analysis of the correlation of qualitative variables deals with nonlinearity.
Converting quantity variables into qualitative variables in one-dimensional clustering to analyze qualitative variable companionry is also useful for nonlinear analysis purposes.
NEXT 

 Correlation Analysis for Multi-Variable
