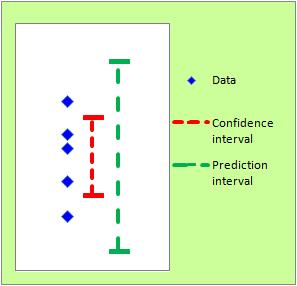
In the figure, the points marked "raw data" are the values of individual samples. This begs the question, "What will be the next sample?" This value is important if you want to make future predictions.
Prediction using statistics is not so much treated in the field of statistics, but it has become a central method in the field of Machine Learning.
In machine learning, predicted values for point estimation are often used, but there are ways to predict them as intervals.
By the way, "predict" in statistics does not necessarily mean estimation of future data.

In the figure, the points marked "raw data" are the values of individual samples. This begs the question, "What will be the next sample?" This value is important if you want to make future predictions.
The prediction interval answers that question. A prediction interval is an interval in which an individual sample is considered to have a value with some probability. In the figure, I tried to draw a case with a probability of 95%.

If the new sample values fall into this interval, the expected result is expected. If it is outside the interval, it may be data in an abnormal state.
Prediction intervals can be used as a way to Model of Outlier and Model of Abnormal but not Outlier.
When making a judgment, a numerical value (threshold) is required as a guide. You can use the prediction interval as the basis for that number.
There are characteristics in the way in which the width of the prediction interval is determined.
When I try to use the prediction interval in practice, I think, "If it is so wide, I can't rely on it, so I can't use it for a while. . ." There is such a thing. To narrow the interval, consider these properties.
If you simply want to narrow the appearance of the interval, you can play around with the probabilities. If you are thinking about practical purposes, you can increase the sample (also called "increasing the n number"). You need to investigate the cause of the magnitude of the standard deviation (variability in the data) to reduce the standard deviation.
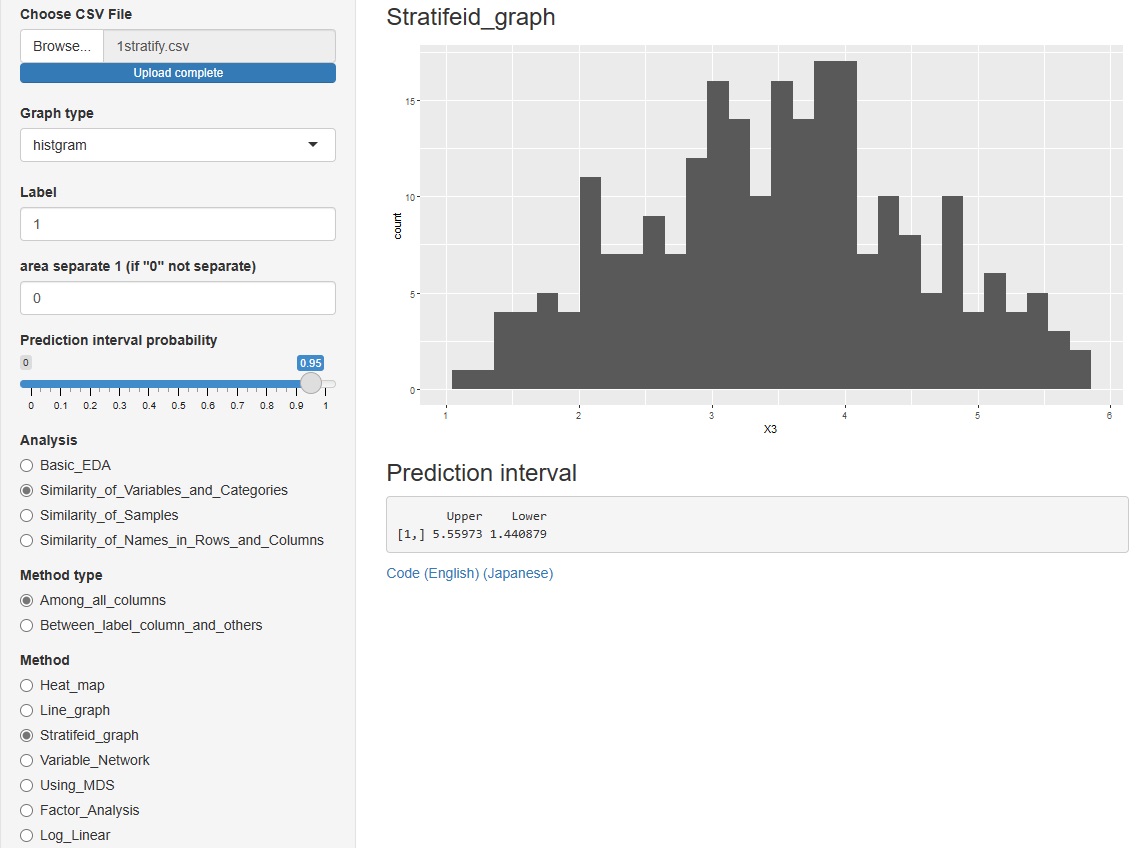
Example of R can be found in Analysis of prediction interval by R.
R-EDA1
can also do it.

Strength and Weakness of Big Data
NEXT 

 Information Theory
