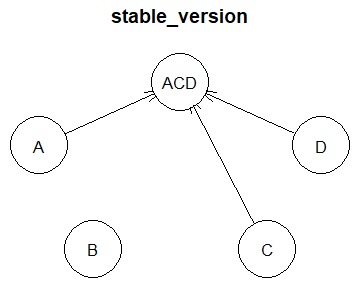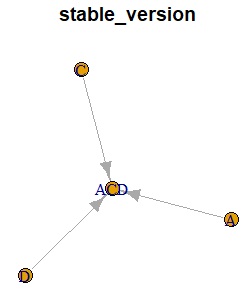
This is an example by R of Bayesian Network .
This page currently only summarizes how Structure Analysis by Bayesian Network . It is a method used for causal analysis.
library(bnlearn)
setwd("C:/Rtest")
Data <- read.csv("Data.csv", header=T)
In Bayesian networks, the type of variable determines the result. It is good to decide the policy while considering the meaning of variables. Also, by considering the differences between types and results, you may be able to better understand the phenomenon that the data represents.
Qualitative variables are converted to factor type because it causes an error if they are automatically recognized as characters.
for (i in 1:ncol(Data)) {
if (class(Data[,i]) == "character") {
Data[,i] <- as.factor(Data[,i])
}
}
If an integer type is included, it will be automatically recognized as an integer and must be converted to a numeric type or a factor type. For example, if the size of the numbers has no special meaning, it is better to use the factor type.
When making it a numeric type.
for (i in 1:ncol(Data)) {
if (class(Data[,i]) == "integer") {
Data[,i] <- as.numeric(Data[,i])
}
}
When making it a factor type.
for (i in 1:ncol(Data)) {
if (class(Data[,i]) == "integer") {
Data[,i] <- as.factor(Data[,i])
}
}
Bayesian networks can be done with only numeric types or a mixture of numeric and factor types, but all factor types can be a better analysis. The following is how to make the numeric type a factor type.
Note that the result of this code changes depending on whether the integer type variable is originally a numeric type or a factor type in the above integer type processing. If it's a factor type, this code doesn't change anything.
for (i in 1:ncol(Data)) {
if (class(Data[,i]) == "numeric") {
Data[,i] <- droplevels(cut(Data[,i], breaks = 3, include.lowest = TRUE))
}
Data[,i] <- as.factor(Data[,i])
}
Below, the graph drawing is also included in one line of code.

plot(pc.stable(Data),main = "PC")
plot(gs(Data),main = "GS")
plot(iamb(Data),main = "IAMB")
plot(fast.iamb(Data),main = "Fast-IAMB")
plot(inter.iamb(Data),main = "Inter-IAMB")
plot(iamb.fdr(Data),main = "IAMB-FDR")
plot(mmpc(Data),main = "MMPC")
plot(si.hiton.pc(Data),main = "SI-HITON-PC")
plot(hpc(Data),main = "HPC")
plot(hc(Data),main = "HC")
plot(tabu(Data),main = "Tabu")
plot(mmhc(Data),main = "MMHC")
plot(h2pc(Data),main = "H2PC")
plot(rsmax2(Data),main = "RSMAX2")
plot(chow.liu(Data),main = "Chow_Liu")
plot(aracne(Data),main = "ARACNE")
Below is the BNSL library
library(BNSL)
plot(bnsl(Data),main = "BNSL")
Below is the deal library
library(deal)
pre.network <- network(Data)
prior.dist <- jointprior(pre.network)
update <- learn(pre.network, Data, prior.dist)
post.network <- autosearch(getnetwork(update), Data, prior.dist, trace=FALSE)
plot(getnetwork(post.network),main = "deal")

library(igraph)
plot(graph.data.frame(pc.stable(Data)$arcs),main = "PC")
plot(graph.data.frame(gs(Data)$arcs),main = "GS")
plot(graph.data.frame(iamb(Data)$arcs),main = "IAMB")
plot(graph.data.frame(fast.iamb(Data)$arcs),main = "Fast-IAMB")
plot(graph.data.frame(inter.iamb(Data)$arcs),main = "Inter-IAMB")
plot(graph.data.frame(iamb.fdr(Data)$arcs),main = "IAMB-FDR")
plot(graph.data.frame(mmpc(Data)$arcs),main = "MMPC")
plot(graph.data.frame(si.hiton.pc(Data)$arcs),main = "SI-HITON-PC")
plot(graph.data.frame(hpc(Data)$arcs),main = "HPC")
plot(graph.data.frame(hc(Data)$arcs),main = "HC")
plot(graph.data.frame(tabu(Data)$arcs),main = "Tabu")
plot(graph.data.frame(mmhc(Data)$arcs),main = "MMHC")
plot(graph.data.frame(h2pc(Data)$arcs),main = "H2PC")
plot(graph.data.frame(rsmax2(Data)$arcs),main = "RSMAX2")
plot(graph.data.frame(chow.liu(Data)$arcs),main = "Chow_Liu")
plot(graph.data.frame(aracne(Data)$arcs),main = "ARACNE")
plot(graph.data.frame(bnsl(Data)$arcs),main = "BNSL")
「bnlearn.com」
This is the homepage of the author of bnlearn (Marco Scutari). It is compactly organized.
https://www.bnlearn.com
「CRAN」
Contains details of bnlearn.
https://cran.r-project.org/web/packages/bnlearn/bnlearn.pdf
BNSL has a function to create undirected graphs as well as directed graphs, but the above example is only directed graphs.
「CRAN」
The details of BNSL are written.
https://cran.r-project.org/web/packages/BNSL/BNSL.pdf
