library(GPArotation)
setwd("C:/Rtest")
Data <- read.csv("Data.csv", header=T)
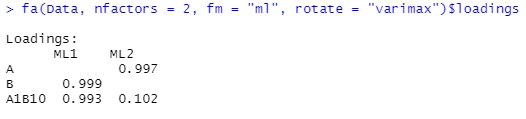
fa(Data, nfactors = 2, fm = "ml", rotate = "varimax")$loadings # Assuming the number of factors is 2, output the factor loadings
This is an example of Factor Analysis by R.
library(psych)
library(GPArotation)
setwd("C:/Rtest")
Data <- read.csv("Data.csv", header=T)
fa(Data, nfactors = 2, fm = "ml", rotate = "varimax")$loadings # Assuming the number of factors is 2, output the factor loadings
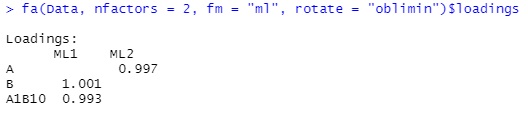
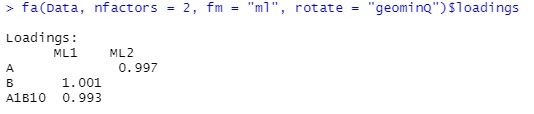
In the data of this example, variables A and B are created with random numbers. Both are random numbers that have a normal distribution with a mean of 10 and a standard deviation of 1. A and B are uncorrelated. There is a variable called A1B10, this is,
A1B10 = A + 10B + random number(mean=0, standard deviation=0.1)
has been made in the expression.
Therefore, the factor ML1 is B and the factor ML2 is A, and the factors can be found almost accurately. The factor loadings of A1B10 are 0.993 and 0.102, because the former is almost 10 times the latter, so we can find a way to create the original variable.
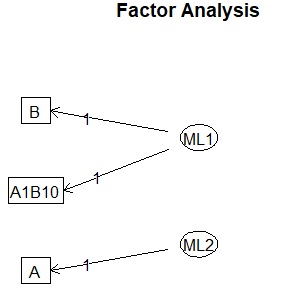
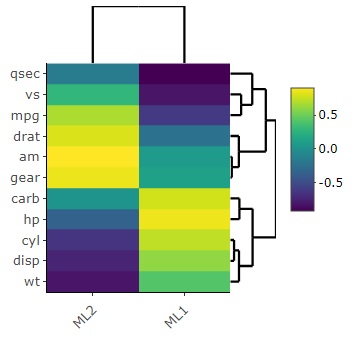
There are two examples of graphing factor loadings. The heat map can be partially enlarged, which is convenient when there are many items.
library(psych)
library(GPArotation)
setwd("C:/Rtest")
Data <- read.csv("Data.csv", header=T)
fa.diagram(fa(Data, nfactors = 2, fm = "ml", rotate = "varimax"))
library(psych)
library(GPArotation)
library(heatmaply)
setwd("C:/Rtest")
Data <- read.csv("Data.csv", header=T)
heatmaply(fa(Data, nfactors = 2, fm = "ml", rotate = "varimax")$loadings)
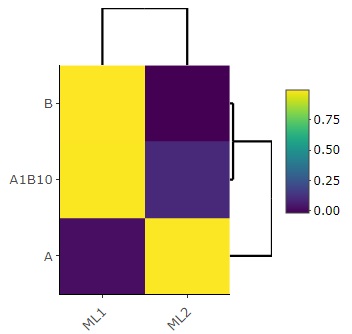
Since the graph automatically cuts small values ??of factor loading, I think it is more reliable to check the numerical data directly so as not to overlook the small values.
In the above, varimax is used as the type of rotation. In conclusion , varimax is a good place to Search for hidden variables. There are other rotation methods for psych, but they are less sensitive.
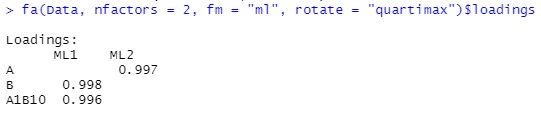
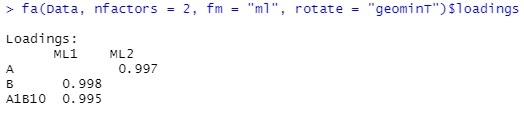
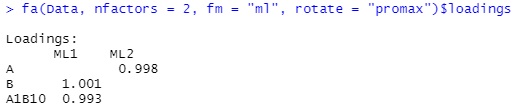
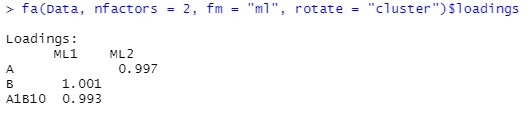
In varimax, it was possible to derive that the variable A1B10 was influenced by two factors, but in the other rotations, it was not possible to derive that the influence of A was on A1B10.
It should be noted that the Search for hidden variables features of the analysis carried out in the will be following.
I found in the above example that varimax seems to be the best in such cases, but it does not mean that varimax should be used for any analysis.
R's relatively old literature introduces factanal as a library for factor analysis.
Since factanal can be used with the default R, there is no need to install the library or load the library. Also, varimax and promax can be used.
Therefore, if your goal is to search for hidden variables , factanal is easier than psych.
However, when I try to execute the above example with factanal, the following error occurs and the calculation cannot be performed. An error will occur even if there are four variables. If you have 5 variables, you will be able to search for 2 factors.
Considering this point, it seems better to use psych, even if it is a little troublesome.
The above was an analysis looking at the relationship between variables and factors.
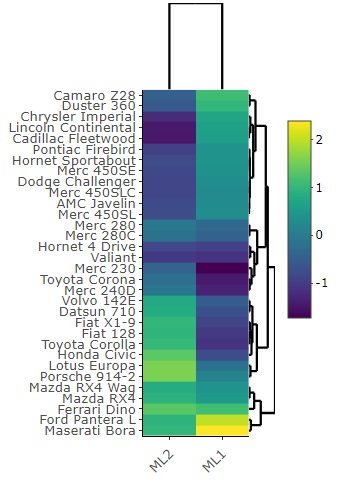
As a usage of factor analysis, there are times when you want to see the relationship between a sample and a factor, so an example in that case is as follows.
library(psych)
library(GPArotation)
library(heatmaply)
setwd("C:/Rtest")
Data <- read.csv("Data.csv", header=T, row.names=1)
fa_result <- fa(Data, nfactors = 2, fm = "ml", rotate = "varimax")
heatmaply(fa_result$loadings)Å@# Analysis of relationship between variables and factors
heatmaply(fa_result$scores)Å@# Analysis of relationship between samples and factors