On the page of prediction by statistical model, it is written that "If you put the value when you want to predict in the formula you made and calculate it, the predicted value can be obtained", but doing this by hand is a lot of work. is. On the other hand, the method of doing with software such as R, Python, RapidMiner as in how to use software for prediction is also troublesome as it is.
Although not all-purpose, Excel provides two types of prediction functions.
Exponential smoothing method and multiple regression analysis .
The exponential smoothing method is also easy to use with a dedicated button.
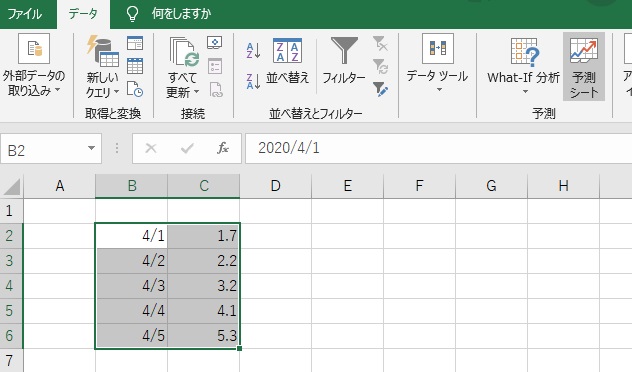
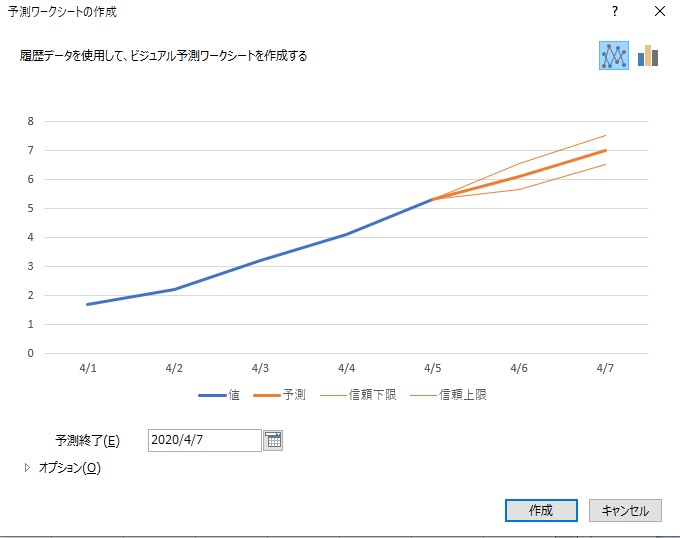
Prepare a column of data on the time axis and a column of data you want to predict, and click "Forecast Sheet" on the "Data" tab.
Click Create.
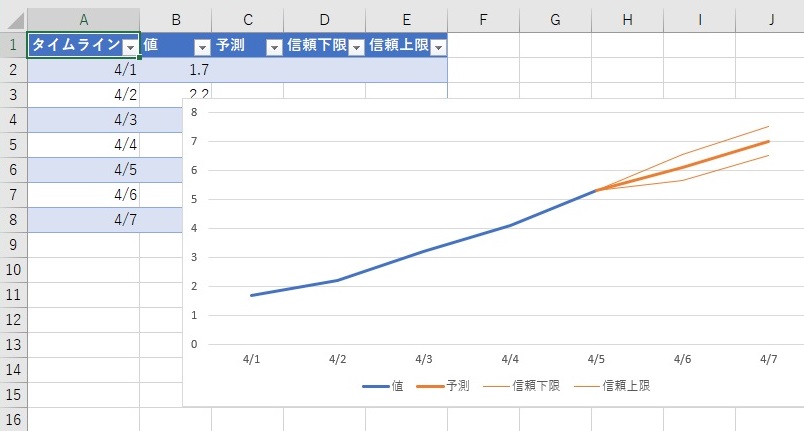
I was able to do it.
The above example remains the default. The range of confidence intervals and the expected duration can be changed in the options of the sheet with the "Create" button.
If you look at the data cells in the resulting graph, you can see that a function called "FORECAST.ETS" is used. This function is a function of the exponential smoothing method for prediction.
In Excel, a function called "FORECAST.ETS" or its companion that calculates the confidence interval "FORECAST.ETS.CONFINT" can be easily used with the touch of a button, but like a general function, somewhere. You can also write a function in the cell and output the calculation result in that cell.
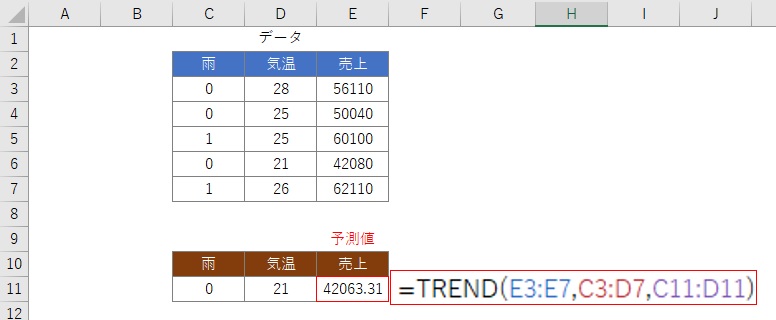
The TREND function can be used to make predictions by multiple regression analysis . You can have one or more variables in X. However, the number of variables (number of columns) should be less than the number of samples (number of rows).
To see how certain this prediction is, it's easy to enter a known X and see how far it is from the known Y.
If you want to know the coefficient of determination and the specific form of the formula, you can use "Regression analysis" in "Data analysis" of the Excel add-in.
In the case of weather, we would like to set the data to "fine", "rain", and "cloudy", but since the TREND function can only handle numerical data, we set "rain = 1" here.
Since only 0 and 1 are not good, you can set "cloudy = 0.5" or "half-day rain = 0.5".
In the exponential smoothing method, the data representing the time point (time or date) is X. If you don't know the specific date, you can put it as 1,2,3,4, for example.
In regression analysis, the information that is likely to affect Y is X.
For example, if you use regression analysis in a case suitable for exponential smoothing, it will look like the figure. The exponential smoothing method is a good predictor. However, the regression analysis with the time point data as X makes the predicted value look erratic.
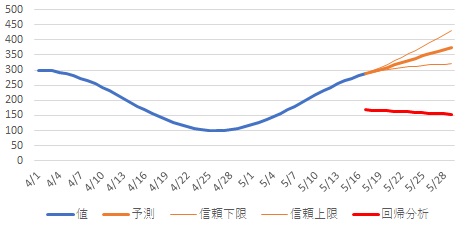
The exponential smoothing method is a method of predicting by looking only at the movement of Y. Regression analysis is a way to predict Y by looking at X that is likely to affect Y.
As a way to consider the influence of X while looking at the latest movement of Y, it seems that the idea of the AR model should be used.
The TREND function of regression analysis is used, but this method can be done by preparing the value of Y at the time before or two before as a variable of X.
