The pivot table was taught by a colleague of the company in 2003. It was already there by that time, but many people who use Excel regularly do not know it.
There are various types of software for business data analysis called "BI (Business Intelligence)", but analysis using a pivot table is similar to analysis using BI. You can perform deep data analysis, which is called "drill down".
If you select the range of data and select the pivot table from Insert, a screen will appear where you can freely aggregate with the GUI. It is very convenient to be able to aggregate data using a function such as "GROUP BY" in R or Python with a GUI.
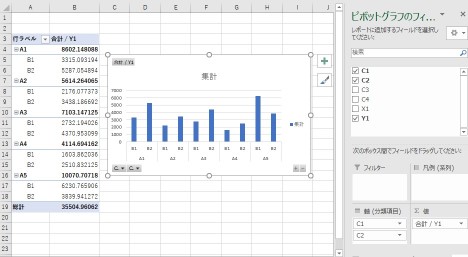
When you create a graph on a PivotTable sheet, it becomes a PivotChart. The contents of the pivot table will be a graph as it is.
Although there are still some inconveniences such as not having the aggregated values ??you want or not being able to use scatter plots, you can do so-called interactive graphical analysis .
